
- PREMIUM
- LIVE QUOTES
- INSTITUTIONS
 Index Options
 State Street
 CME Group
 Nasdaq
 Cboe
Cboe TradingView
 Wall Street Journal
Is Adobe’s AI Push Creating an Opportunity After a 22.9% Share Price Slide?
- Wondering if Adobe is a bargain or a trap at today’s price? You are not alone, especially with so much noise around big tech valuations right now.
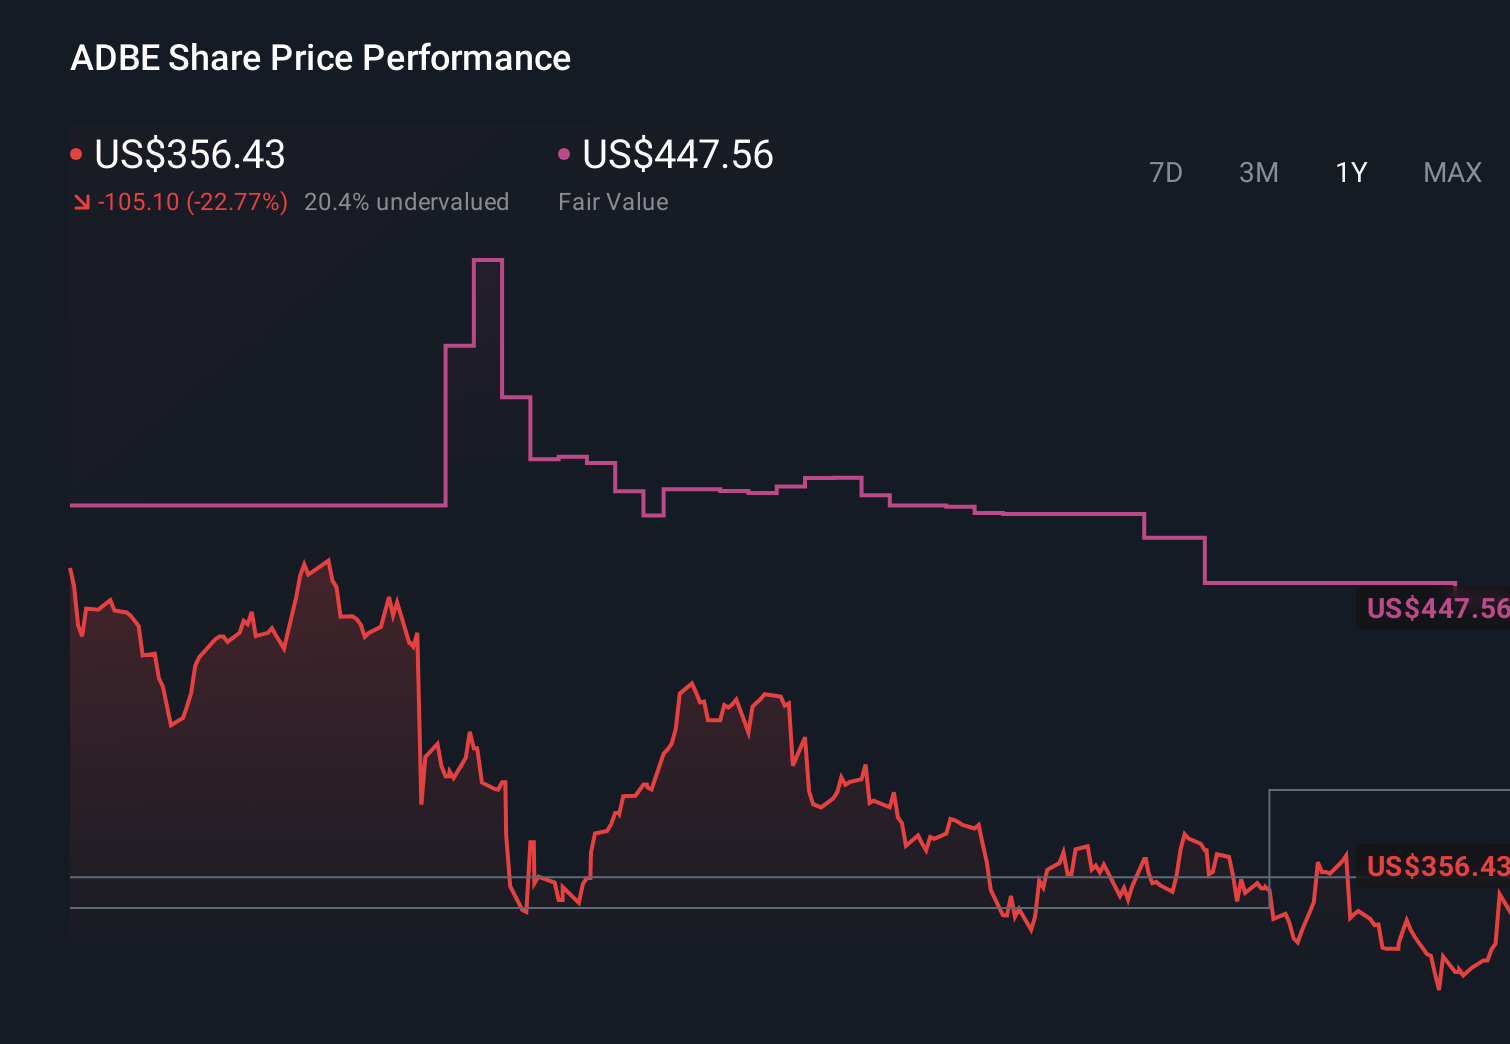
- Over the last week the stock has inched up about 2.0%, and it is up roughly 6.1% over the past month, but shares are still down around 20.4% year to date and 22.9% over the last year, leaving many investors questioning whether the pullback has gone too far.
- Recent headlines have focused on Adobe’s aggressive push into AI powered creative tools and its continued dominance with Creative Cloud subscriptions. The market sees this as both a moat and a growth engine. At the same time, regulators and competitors are watching closely as Adobe deepens its ecosystem, feeding into the debate about how much future growth is already priced in.
- On our checks, Adobe scores a solid 5/6 valuation score, suggesting it looks undervalued on most, but not all, of the key metrics we track. Next we will break down what different valuation methods say about the stock, and then look at a more powerful way to tie them together at the end of the article.
Find out why Adobe's -22.9% return over the last year is lagging behind its peers.
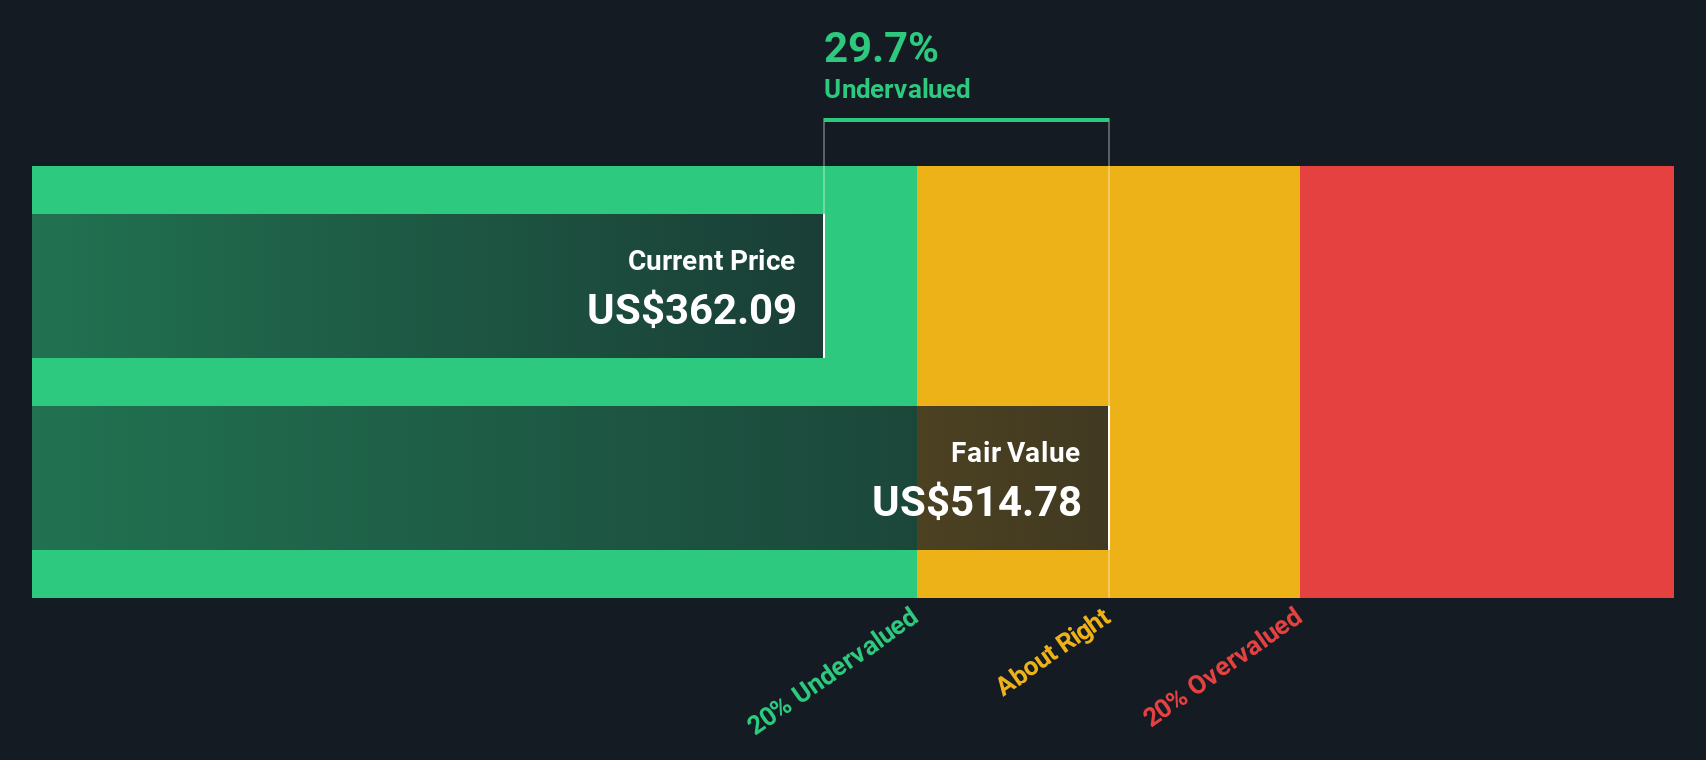
Approach 1: Adobe Discounted Cash Flow (DCF) Analysis
A Discounted Cash Flow, or DCF, model estimates what a business is worth today by projecting its future cash flows and discounting them back to the present using a required rate of return.
For Adobe, the model starts with last twelve month Free Cash Flow of about $9.5 billion and uses analyst forecasts for the next few years, then extends those trends further into the future. By 2030, Simply Wall St projects Adobe could be generating around $13.0 billion in Free Cash Flow, with additional years extrapolated at gradually slowing growth rates.
Those projected cash flows, all in dollars, are discounted back to today under a 2 Stage Free Cash Flow to Equity framework. Summing the discounted values produces an estimated intrinsic value of roughly $522.90 per share. Compared to the current market price, this implies the stock is about 32.8% undervalued on a DCF basis, which suggests investors are not fully pricing in Adobe’s long term cash generation potential.
Result: UNDERVALUED
Our Discounted Cash Flow (DCF) analysis suggests Adobe is undervalued by 32.8%. Track this in your watchlist or portfolio, or discover 912 more undervalued stocks based on cash flows.
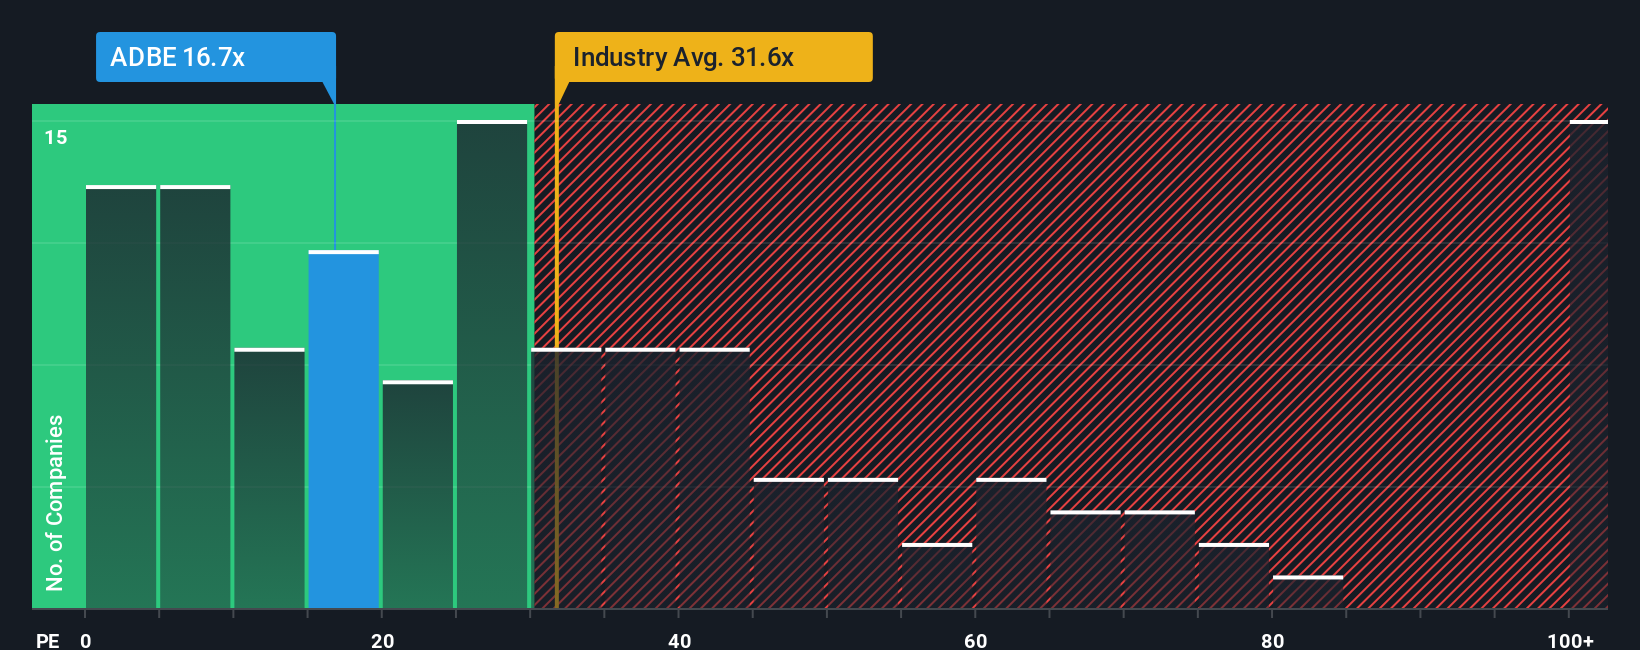
Approach 2: Adobe Price vs Earnings
For a profitable, mature business like Adobe, the Price to Earnings, or PE, ratio is a useful way to gauge how much investors are paying for each dollar of current earnings, and to compare that to what they pay for similar companies.
In general, faster growth and lower risk justify a higher PE, while slower growth or higher uncertainty should pull a “normal” or “fair” PE lower. Adobe currently trades on a PE of about 20.6x, which is below both the broader Software industry average of roughly 32.4x and the peer group average of around 56.0x. This suggests the market is assigning it a discount.
Simply Wall St’s Fair Ratio framework takes this a step further by estimating what PE Adobe should trade on, given its earnings growth profile, profitability, industry, market cap and risk factors. For Adobe, this Fair Ratio is calculated at about 35.5x, materially above the current 20.6x. Because this approach is tailored to the company’s fundamentals, rather than just comparing it to peers that may have very different prospects or risk, it offers a more nuanced view of value and currently points to the shares being attractively priced.
Result: UNDERVALUED
PE ratios tell one story, but what if the real opportunity lies elsewhere? Discover 1455 companies where insiders are betting big on explosive growth.
Upgrade Your Decision Making: Choose your Adobe Narrative
Earlier we mentioned that there is an even better way to understand valuation, so let us introduce you to Narratives, a simple way to connect your view of a company’s story with a structured forecast of its future revenue, earnings and margins, and then turn that into a Fair Value you can compare to today’s price.
On Simply Wall St’s Community page, Narratives let you write the story you believe about Adobe, link it to clear assumptions, and instantly see whether that story says the stock is worth more or less than the current market price, helping you decide if it looks like a buy, hold or sell.
Narratives are dynamic, automatically updating when new information such as earnings reports or major product news lands. This helps your Fair Value stay in sync with the latest data without you needing to rebuild a model from scratch.
For example, some investors currently see Adobe’s Fair Value up near about $605 per share, while more cautious investors are closer to roughly $380. By exploring these different Narratives side by side you can quickly see how different stories about Adobe’s AI execution, margins and growth translate into very different estimates of what the stock is really worth.
Do you think there's more to the story for Adobe? Head over to our Community to see what others are saying!
This article by Simply Wall St is general in nature. We provide commentary based on historical data and analyst forecasts only using an unbiased methodology and our articles are not intended to be financial advice. It does not constitute a recommendation to buy or sell any stock, and does not take account of your objectives, or your financial situation. We aim to bring you long-term focused analysis driven by fundamental data. Note that our analysis may not factor in the latest price-sensitive company announcements or qualitative material. Simply Wall St has no position in any stocks mentioned.
Have feedback on this article? Concerned about the content? Get in touch with us directly. Alternatively, email editorial-team@simplywallst.com