
- PREMIUM
- LIVE QUOTES
- INSTITUTIONS
 Index Options
 State Street
 CME Group
 Nasdaq
 Cboe
Cboe TradingView
 Wall Street Journal
Is Iron Mountain’s Post Rally Pullback a Fresh Opportunity in 2025?
- Wondering if Iron Mountain at around $82 a share is still a smart long term bet or if the best gains are already behind it? You are not alone, and this article will unpack whether the current price really lines up with the company’s fundamentals.
- Despite a hefty 249.0% gain over five years and 82.6% over three years, the stock has pulled back recently, down 2.4% over the last week, 9.8% over the last month, and 21.3% year to date, leaving some investors questioning whether this is a buying opportunity or a warning sign.
- Recent market attention has centered on Iron Mountain’s ongoing push into data centers and digital infrastructure, as investors reassess how much of a premium to place on its hybrid of traditional storage and higher growth digital services. At the same time, broader rate expectations and sentiment around real estate linked names have added volatility, which helps explain why the share price has softened even as the long term transformation story remains intact.
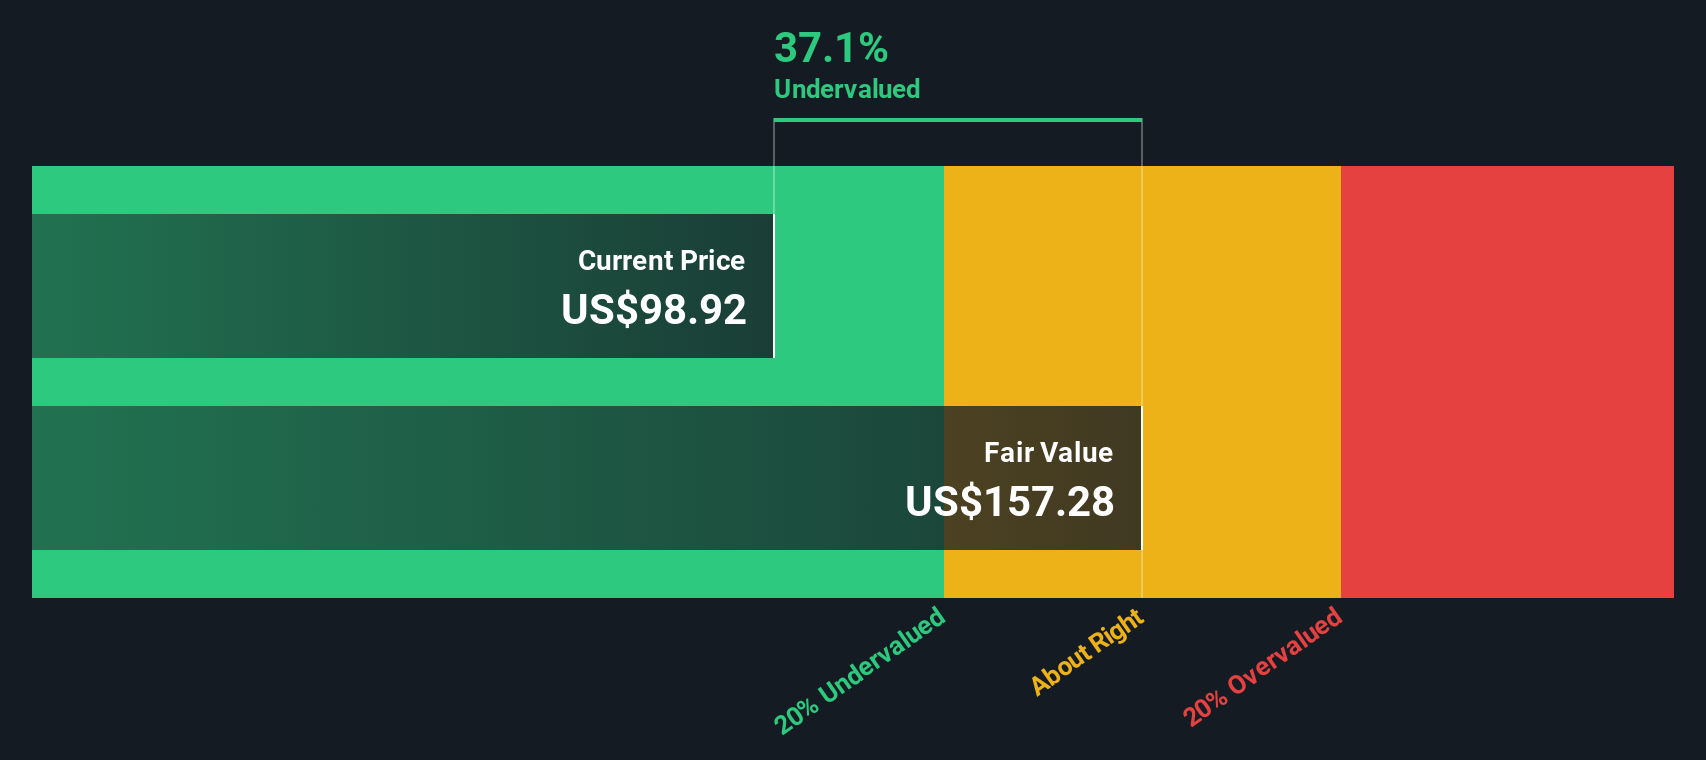
- On our valuation framework, Iron Mountain scores a solid 5/6 for being undervalued across key checks, suggesting that the recent pullback might not tell the full story. Next we will walk through the main valuation methods and hint at an even richer way to think about fair value that we will come back to at the end of the article.
Find out why Iron Mountain's -23.3% return over the last year is lagging behind its peers.
Approach 1: Iron Mountain Discounted Cash Flow (DCF) Analysis
A Discounted Cash Flow model takes Iron Mountain’s adjusted funds from operations, projects how they might grow in the future, and then discounts those future cash flows back to today in dollar terms to estimate what the business is worth now.
Iron Mountain currently generates around $1.34 billion in free cash flow, and analyst forecasts, extended by Simply Wall St beyond the formal forecast horizon, point to this rising to roughly $5.07 billion by 2035. The 2 stage Free Cash Flow to Equity model, using these projections and an appropriate discount rate, produces an estimated intrinsic value of about $216 per share.
With the stock currently trading around $82, the DCF implies it is trading at roughly a 61.8% discount to its estimated fair value. This suggests that the market is pricing in much weaker long term cash flow growth or higher risk than this model assumes. On this framework, Iron Mountain screens as meaningfully undervalued for long term investors who believe in the durability of its cash generation.
Result: UNDERVALUED
Our Discounted Cash Flow (DCF) analysis suggests Iron Mountain is undervalued by 61.8%. Track this in your watchlist or portfolio, or discover 906 more undervalued stocks based on cash flows.
Approach 2: Iron Mountain Price vs Sales
For a company like Iron Mountain, where reported earnings can be distorted by depreciation and non cash items, the price to sales ratio is a useful way to compare what investors are paying for each dollar of revenue across peers.
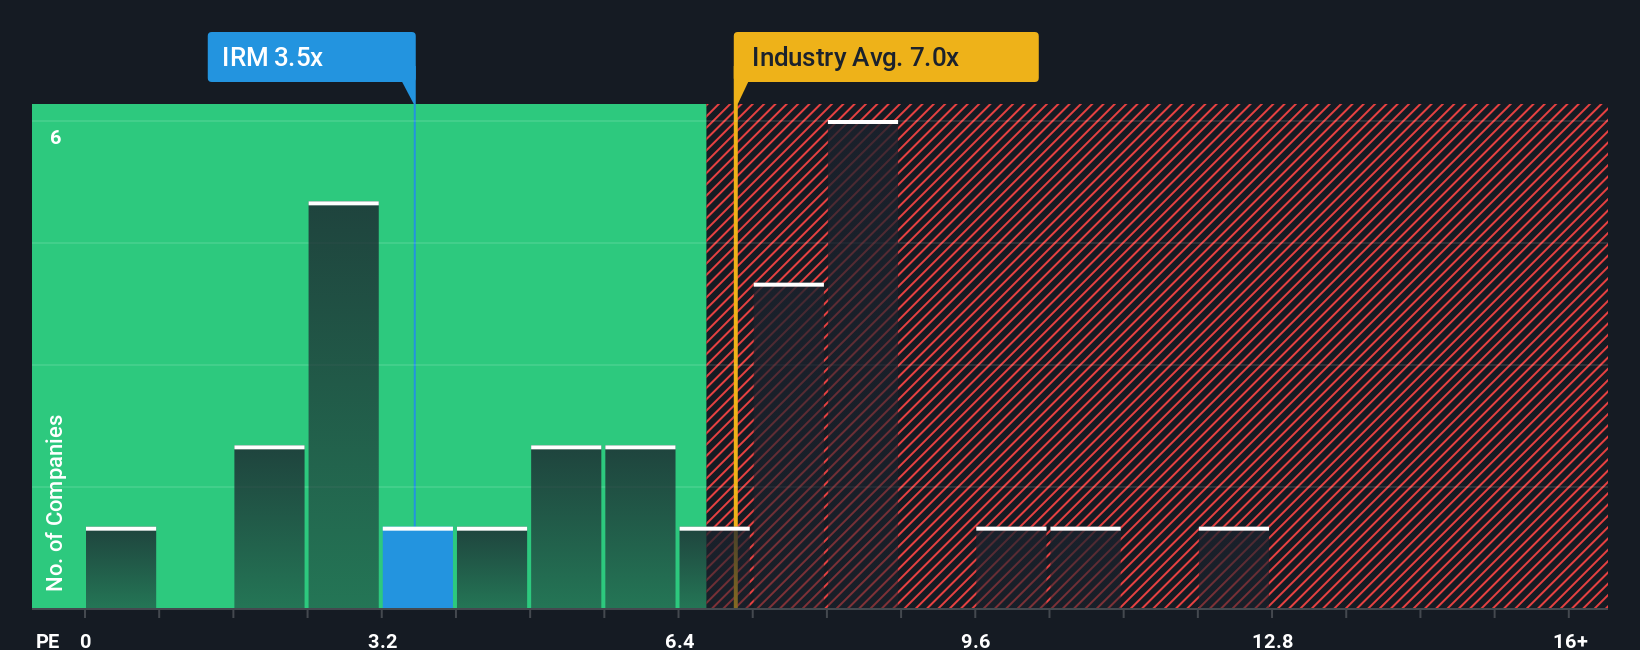
In general, higher growth and lower perceived risk justify a richer sales multiple, while slower or riskier businesses typically trade on a lower multiple. Iron Mountain currently trades on a price to sales ratio of about 3.67x, which is below both the Specialized REITs industry average of roughly 7.07x and the peer group average of around 5.86x.
Simply Wall St’s Fair Ratio framework estimates that, given Iron Mountain’s specific mix of growth, margins, industry positioning, size and risks, a more appropriate sales multiple would be about 5.20x. This approach improves on simple peer or industry comparisons by tailoring the benchmark to the company’s own fundamentals rather than assuming one size fits all. Comparing the Fair Ratio of 5.20x with the current 3.67x suggests the market is applying a meaningful discount to where the shares might trade based on those fundamentals.
Result: UNDERVALUED
PS ratios tell one story, but what if the real opportunity lies elsewhere? Discover 1450 companies where insiders are betting big on explosive growth.
Upgrade Your Decision Making: Choose your Iron Mountain Narrative
Earlier we mentioned that there is an even better way to understand valuation, so let us introduce you to Narratives, where you describe the story you see for Iron Mountain and link that story to your own forecasts for revenue, earnings and margins. These then roll up into a Fair Value you can compare to the current share price to decide whether it looks like a buy, hold or sell. Narratives on Simply Wall St, available to everyone via the Community page used by millions of investors, make this process accessible by guiding you to connect the business drivers you care about with a structured forecast that is automatically updated when new information like earnings, news or guidance arrives. For Iron Mountain, for example, one investor might build a bullish Narrative that looks more like the higher analyst price targets around $140 per share based on rapid data center and digital growth. Another investor could lean toward a more cautious view closer to $44 if they believe debt, competition and short seller concerns will weigh on results. The platform lets you see and compare these perspectives in a consistent, numbers backed way.
Do you think there's more to the story for Iron Mountain? Head over to our Community to see what others are saying!

This article by Simply Wall St is general in nature. We provide commentary based on historical data and analyst forecasts only using an unbiased methodology and our articles are not intended to be financial advice. It does not constitute a recommendation to buy or sell any stock, and does not take account of your objectives, or your financial situation. We aim to bring you long-term focused analysis driven by fundamental data. Note that our analysis may not factor in the latest price-sensitive company announcements or qualitative material. Simply Wall St has no position in any stocks mentioned.
Have feedback on this article? Concerned about the content? Get in touch with us directly. Alternatively, email editorial-team@simplywallst.com