
- PREMIUM
- LIVE QUOTES
- INSTITUTIONS
 Index Options
 State Street
 CME Group
 Nasdaq
 Cboe
Cboe TradingView
 Wall Street Journal
Is It Too Late To Consider Chubb After Its Strong Multi Year Share Price Run?
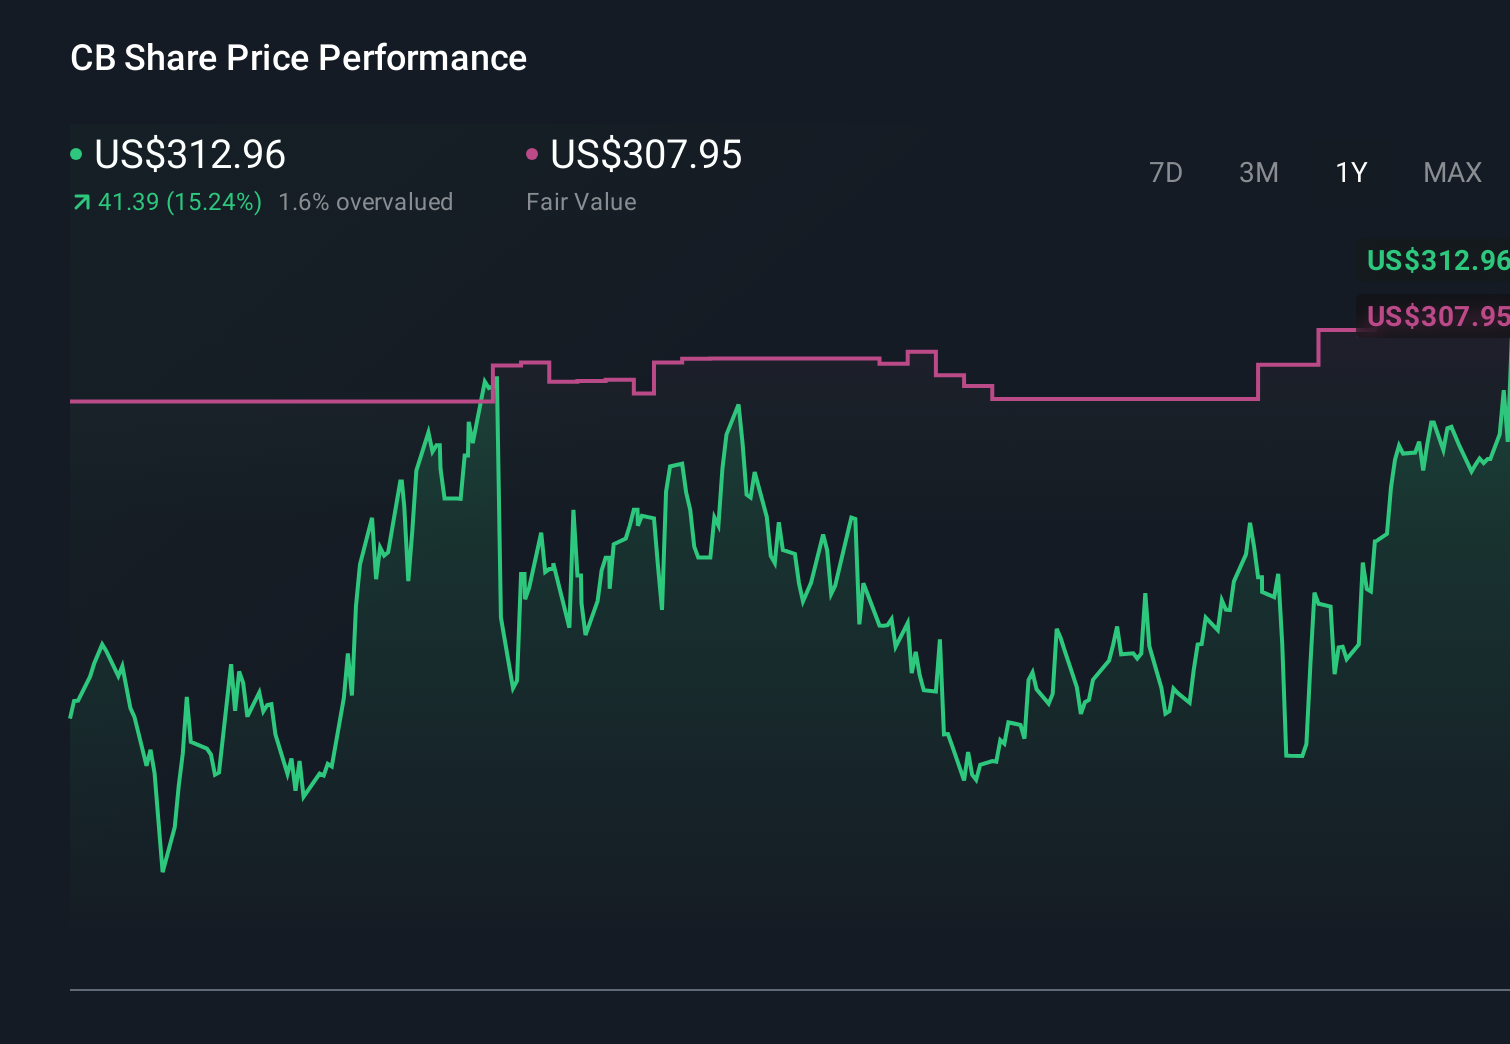
- Wondering if Chubb at around $312 a share is still worth buying, or if the real upside has already been priced in? This breakdown is designed to help you decide with a clear valuation lens.
- The stock has climbed 5.2% over the last week, 5.8% over the past month, and is up 14.7% year to date, adding to an impressive 54.0% gain over 3 years and 122.5% over 5 years.
- These moves have come as investors focus more on high quality insurers with strong underwriting discipline and robust balance sheets, and Chubb has often been cited in industry commentary as a go to name in that space. At the same time, shifting expectations around interest rates and insurance pricing cycles have added fresh attention to the sector, helping support the recent share price strength.
- On our framework, Chubb scores a 4/6 valuation score, meaning it screens as undervalued on four of six checks. That is a solid result, though not perfect. Next, we will unpack what that actually means by looking at different valuation approaches, and then finish with an additional way to think about what Chubb might really be worth over time.
Approach 1: Chubb Excess Returns Analysis
The Excess Returns model looks at how much profit Chubb can generate above the required return that shareholders demand on their capital, and then projects how long those value creating returns can persist.
In this framework, Chubb starts with a Book Value of $182.22 per share and an Average Return on Equity of 13.57%. This translates into a Stable EPS of $28.48 per share, based on weighted future ROE estimates from 13 analysts. The Cost of Equity is estimated at $13.90 per share, implying Chubb is expected to earn an Excess Return of $14.57 per share, a meaningful spread over its capital charge. Analysts also expect the Stable Book Value to grow toward $209.79 per share, reflecting ongoing reinvestment at attractive rates, supported by estimates from 12 analysts.
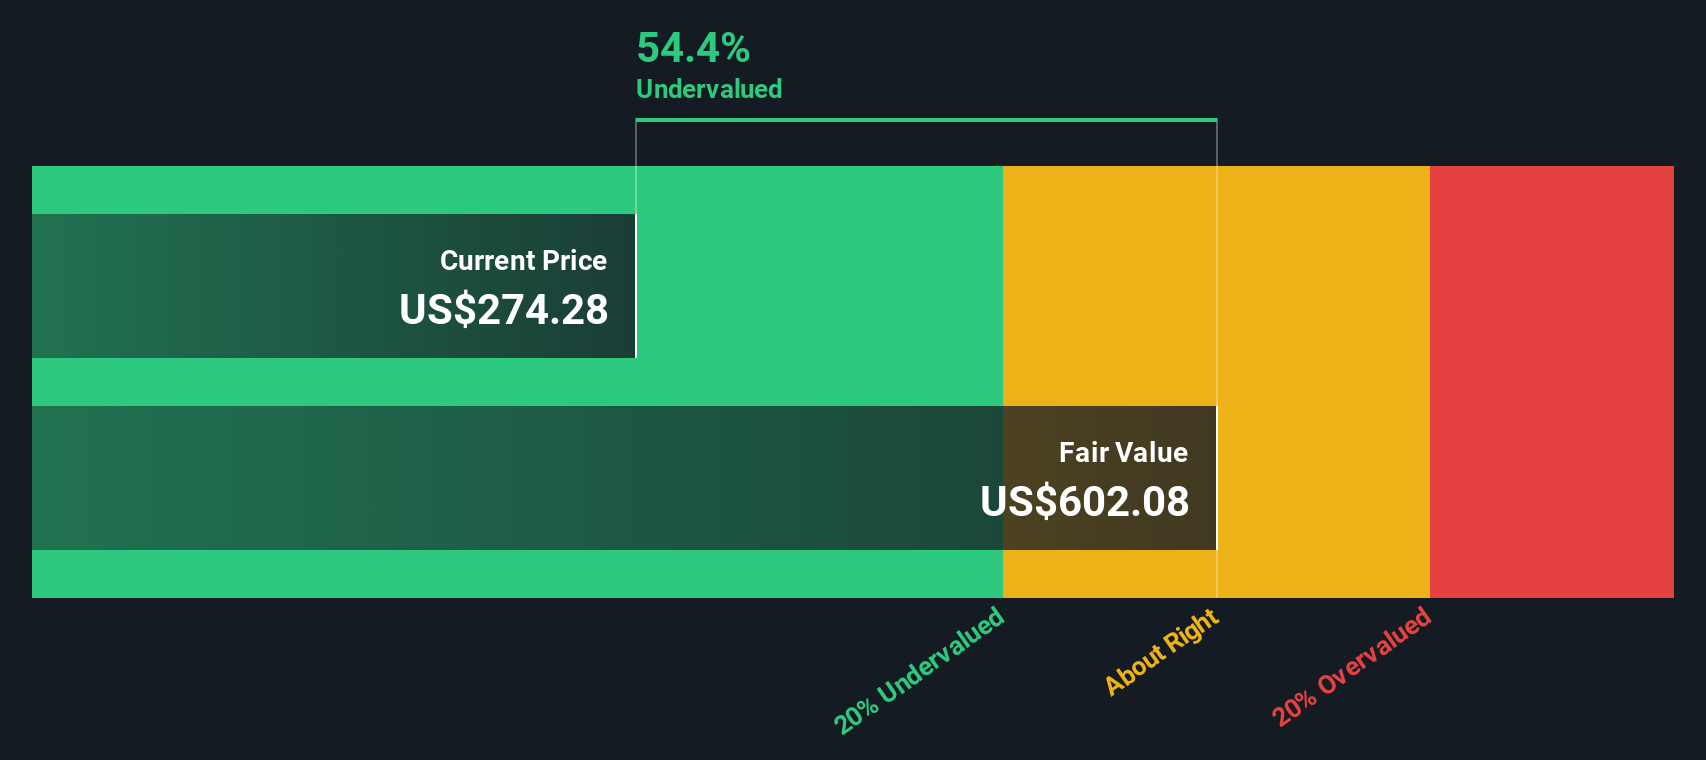
Discounting these excess returns over time yields an intrinsic value of about $642.47 per share. Compared with the current share price near $312, the model implies Chubb is roughly 51.3% undervalued, suggesting the market is not fully pricing in its long run profitability and capital efficiency.
Result: UNDERVALUED
Our Excess Returns analysis suggests Chubb is undervalued by 51.3%. Track this in your watchlist or portfolio, or discover 906 more undervalued stocks based on cash flows.
Approach 2: Chubb Price vs Earnings
For a consistently profitable insurer like Chubb, the price to earnings multiple is a straightforward way to gauge whether investors are paying a reasonable price for each dollar of earnings. In general, faster earnings growth and lower perceived risk warrant a higher PE, while slower growth or higher risk justify a lower one.
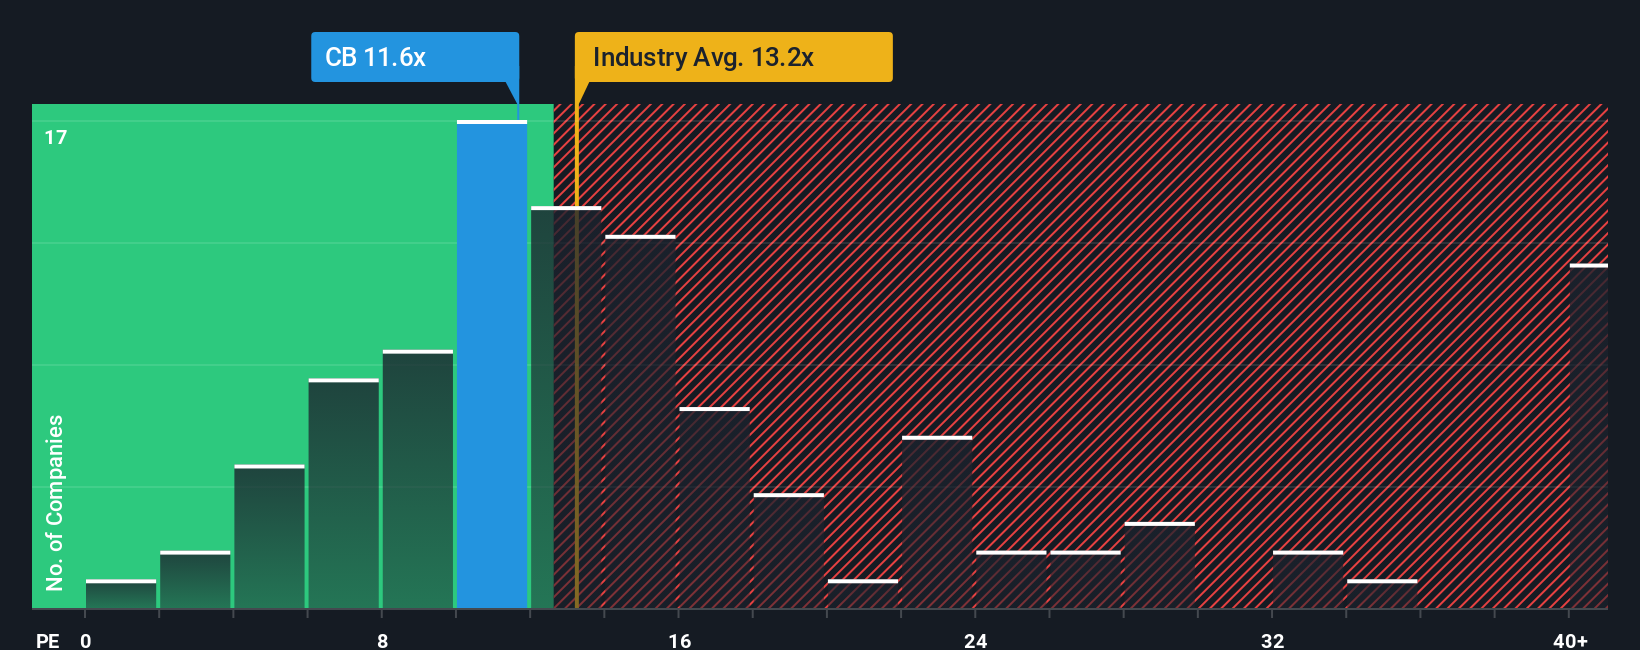
Chubb currently trades at about 12.72x earnings, which is below both the broader insurance industry average of around 13.56x and the peer group average of roughly 10.42x. To refine this comparison, Simply Wall St calculates a Fair Ratio of 13.68x, an estimate of the PE that would make sense given Chubb’s specific earnings growth outlook, margins, risk profile, size, and industry positioning.
This Fair Ratio is more informative than a simple peer or industry comparison because it tailors the benchmark to Chubb’s fundamentals rather than assuming all insurers deserve the same multiple. With the current 12.72x PE sitting below the 13.68x Fair Ratio, the shares appear modestly undervalued on this earnings based lens.
Result: UNDERVALUED
PE ratios tell one story, but what if the real opportunity lies elsewhere? Discover 1449 companies where insiders are betting big on explosive growth.
Upgrade Your Decision Making: Choose your Chubb Narrative
Earlier we mentioned that there is an even better way to understand valuation, so let us introduce you to Narratives, a simple way to connect your view of Chubb’s story to a set of financial forecasts and, ultimately, a fair value estimate. On Simply Wall St’s Community page, Narratives let you describe why you think Chubb’s revenue, earnings, and margins will evolve a certain way, automatically turning that story into projected financials and a fair value that you can compare with today’s price to help inform decisions about whether to buy, hold, or sell. Because Narratives update dynamically as new data comes in, such as earnings results, industry news, or changes in growth and margin assumptions, your fair value stays aligned with the latest information rather than a static model. For example, one Chubb Narrative might lean cautious, using a fair value near $247 based on slower revenue growth. Another might be more optimistic, using a fair value around $308 that assumes stronger margins and a higher future PE multiple. It is this ability to see, compare, and refine different stories that makes Narratives such a powerful, accessible decision making tool.
Do you think there's more to the story for Chubb? Head over to our Community to see what others are saying!
This article by Simply Wall St is general in nature. We provide commentary based on historical data and analyst forecasts only using an unbiased methodology and our articles are not intended to be financial advice. It does not constitute a recommendation to buy or sell any stock, and does not take account of your objectives, or your financial situation. We aim to bring you long-term focused analysis driven by fundamental data. Note that our analysis may not factor in the latest price-sensitive company announcements or qualitative material. Simply Wall St has no position in any stocks mentioned.
Have feedback on this article? Concerned about the content? Get in touch with us directly. Alternatively, email editorial-team@simplywallst.com