
- PREMIUM
- LIVE QUOTES
- INSTITUTIONS
 Index Options
 State Street
 CME Group
 Nasdaq
 Cboe
Cboe TradingView
 Wall Street Journal
Has Nubank’s 325.8% Three Year Surge Left Its Valuation Too Stretched?
- If you are wondering whether Nu Holdings is still a smart buy after its huge run, you are not alone. This stock has quickly moved from a niche fintech play to one of the most talked about names in emerging markets.
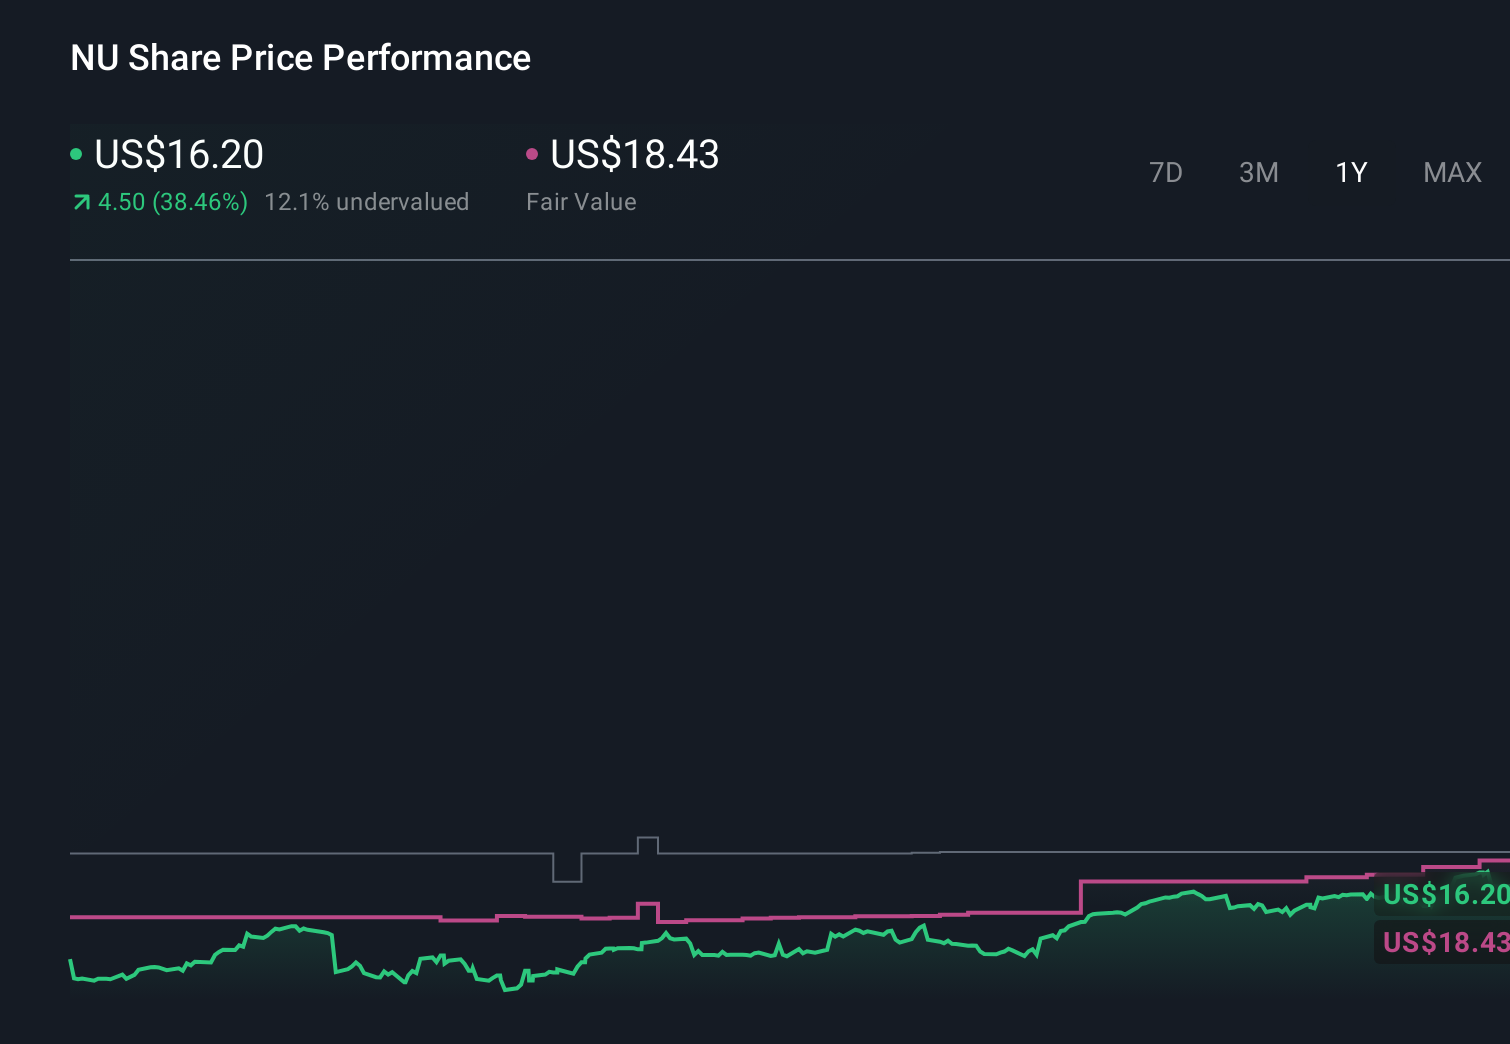
- Over the last week the share price has barely budged, but it is still up 5.2% over 30 days, 56.6% year to date and 325.8% over three years. This indicates that the market has significantly upgraded its view of Nu's growth potential and risk profile.
- That repricing has been driven by Nu's rapid customer growth across Brazil, Mexico and Colombia, along with ongoing product expansion in areas like personal loans and insurance that deepen engagement and monetization. At the same time, the company has been drawing attention for how its digital model is challenging traditional banks across Latin America, prompting investors to reconsider what a profitable, at-scale neobank can be worth.
- Despite all that enthusiasm, Nu currently scores just 0/6 on our valuation checks. This suggests the market may already be pricing in a lot of good news. We will walk through what different valuation methods say about the stock today and then finish with a more nuanced way to think about Nu's long-term value.
Nu Holdings scores just 0/6 on our valuation checks. See what other red flags we found in the full valuation breakdown.
Approach 1: Nu Holdings Excess Returns Analysis
The Excess Returns model asks whether Nu Holdings is generating enough profit on its equity base to justify its current share price, after charging a fair cost for that equity. In other words, it looks at what the company earns above its required return and capitalizes that stream of surplus earnings.
For Nu, the model starts with a Book Value of $2.18 per share and a Stable EPS of $0.99 per share, based on weighted future Return on Equity estimates from 9 analysts. Against a Cost of Equity of $0.38 per share, this implies an Excess Return of $0.61 per share. That is underpinned by an Average Return on Equity of 30.70% and a projected Stable Book Value of $3.21 per share, based on estimates from 6 analysts.
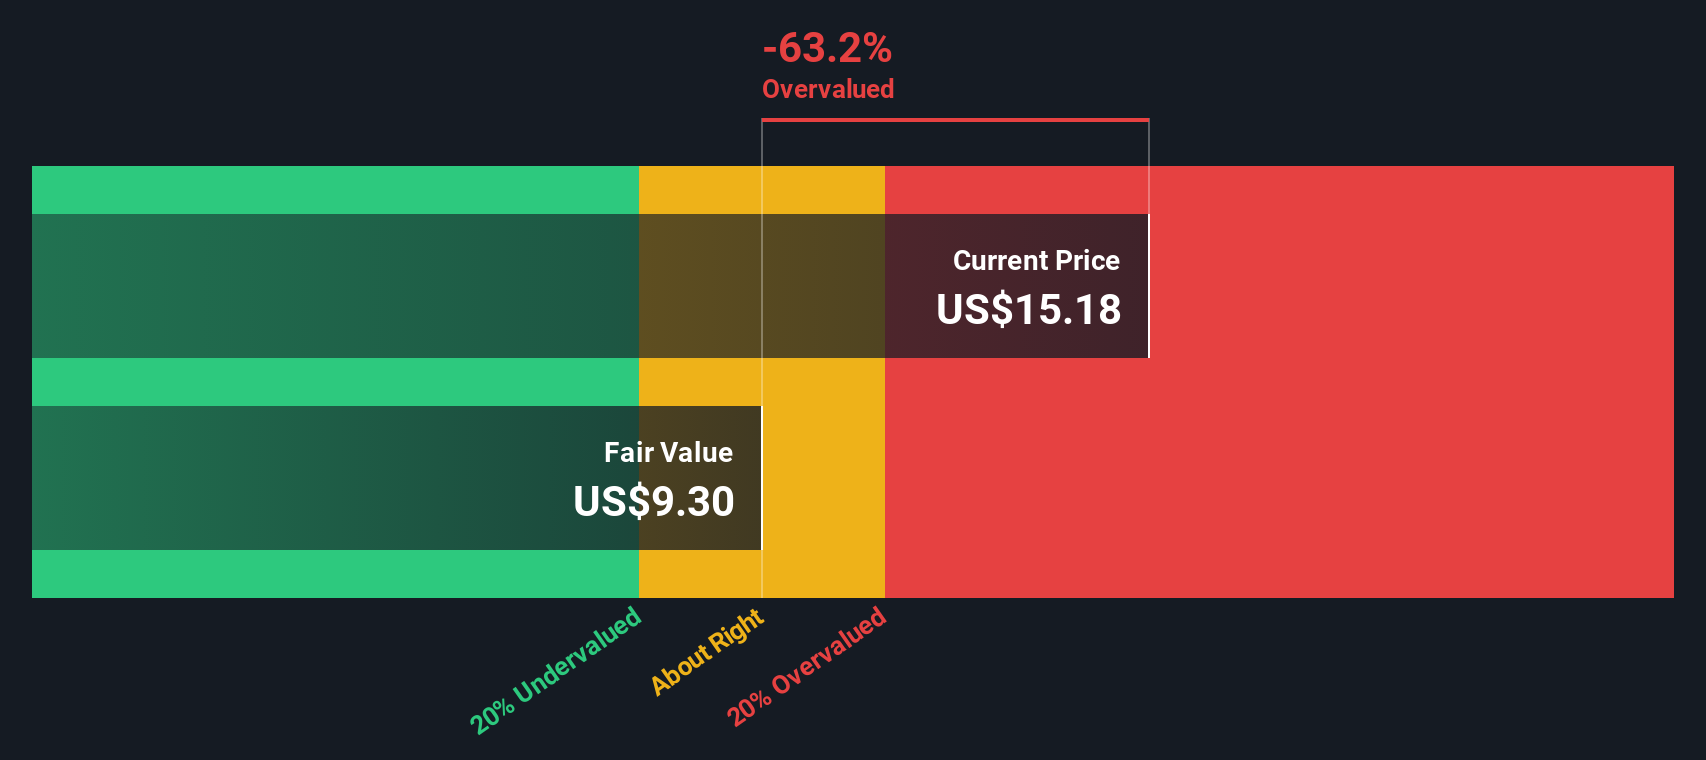
When these excess returns are projected forward and discounted, the model arrives at an intrinsic value of about $10.44 per share. With the Excess Returns valuation indicating the stock is roughly 59.5% above the current price, Nu screens as meaningfully expensive using this approach.
Result: OVERVALUED
Our Excess Returns analysis suggests Nu Holdings may be overvalued by 59.5%. Discover 903 undervalued stocks or create your own screener to find better value opportunities.
Approach 2: Nu Holdings Price vs Earnings
For profitable companies like Nu Holdings, the price to earnings ratio, or PE, is often a useful way to judge valuation because it directly links the share price to the profits each share generates. The faster a business is expected to grow, and the more predictable those earnings are, the higher a PE investors are usually willing to pay. Slower growth or higher risk, on the other hand, typically warrants a lower, more conservative multiple.
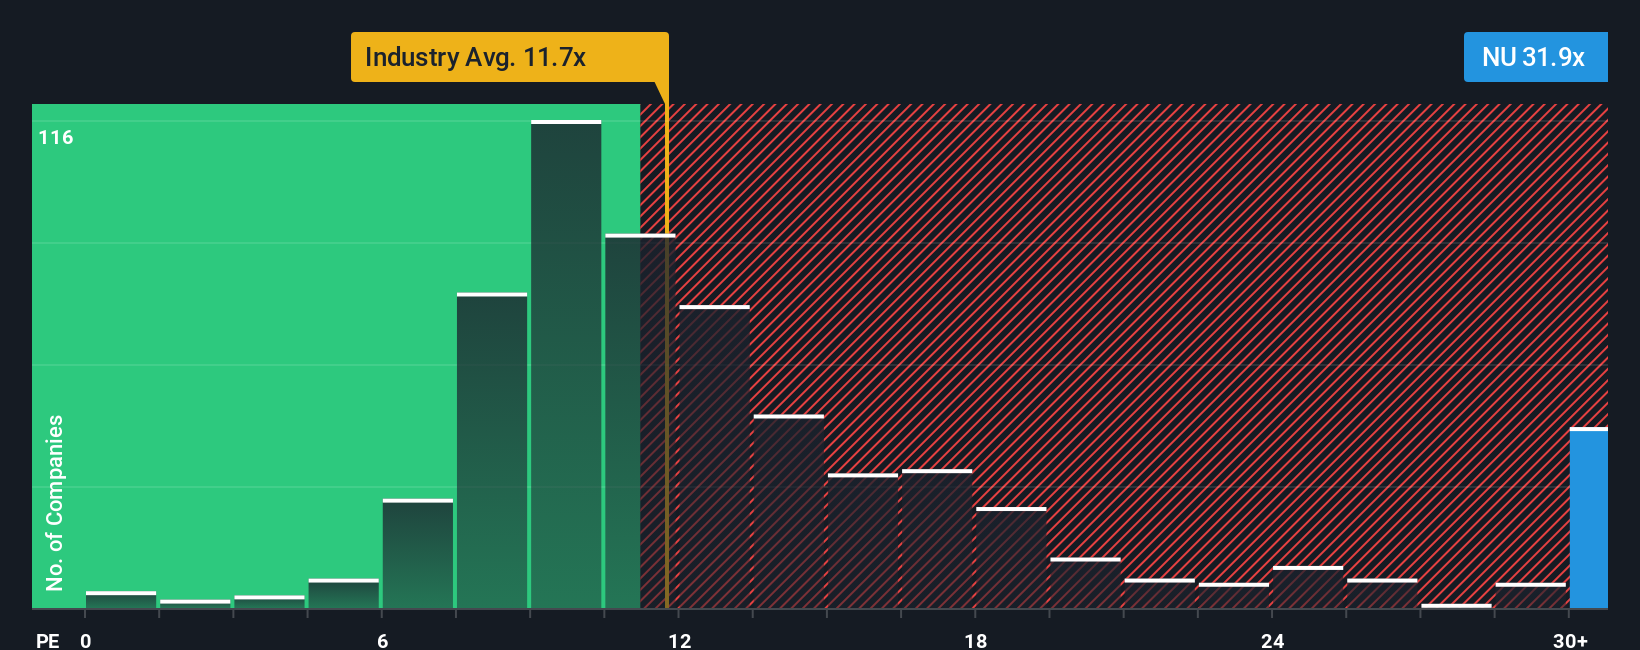
Nu currently trades on a PE of about 31.9x, which is well above the Banks industry average of roughly 12.0x and also ahead of the peer group average of around 13.0x. Simply Wall St's Fair Ratio framework goes a step further by estimating what PE Nu might command, about 22.7x, once its growth outlook, profitability, industry, size and risk profile are all accounted for. This can make it more informative than a simple comparison to peers or the sector, which may overlook how unusual Nu's growth and margins are relative to traditional banks.
Comparing Nu's actual 31.9x PE to the Fair Ratio of 22.7x suggests the market is paying a significant premium to optimistic fundamentals, indicating a stretched valuation on this metric.
Result: OVERVALUED
PE ratios tell one story, but what if the real opportunity lies elsewhere? Discover 1447 companies where insiders are betting big on explosive growth.
Upgrade Your Decision Making: Choose your Nu Holdings Narrative
Earlier we mentioned that there is an even better way to understand valuation. Let us introduce you to Narratives, a simple tool on Simply Wall St's Community page that lets you connect your view of a company with the numbers by telling a story about how you think its revenue, earnings and margins will evolve. This turns that story into a financial forecast and, ultimately, a fair value you can compare to the current share price to help you decide whether to buy, hold or sell. Narratives are dynamic and update automatically as new information like earnings results or major news comes in. This means your fair value view stays current without you having to rebuild your model from scratch. For Nu Holdings, for example, one investor might build a bullish Narrative that assumes the company wins a US bank charter, successfully scales Mexico and Colombia, and deserves a fair value around the most optimistic target near $20. A more cautious investor could create a conservative Narrative that focuses on credit risk and regulatory uncertainty and lands closer to the lower end near $14, with both perspectives coexisting transparently on the platform.
Do you think there's more to the story for Nu Holdings? Head over to our Community to see what others are saying!
This article by Simply Wall St is general in nature. We provide commentary based on historical data and analyst forecasts only using an unbiased methodology and our articles are not intended to be financial advice. It does not constitute a recommendation to buy or sell any stock, and does not take account of your objectives, or your financial situation. We aim to bring you long-term focused analysis driven by fundamental data. Note that our analysis may not factor in the latest price-sensitive company announcements or qualitative material. Simply Wall St has no position in any stocks mentioned.
Have feedback on this article? Concerned about the content? Get in touch with us directly. Alternatively, email editorial-team@simplywallst.com