
- PREMIUM
- LIVE QUOTES
- INSTITUTIONS
 Index Options
 State Street
 CME Group
 Nasdaq
 Cboe
Cboe TradingView
 Wall Street Journal
Assessing McKesson’s Valuation After a 45% Yearly Surge and Strong DCF Upside Potential
- Wondering if McKesson is still a buy after such a powerful run, or if the easy money has already been made? This article will walk through the numbers with you, step by step.
- The stock just closed around $823.01, up 3.1% over the last week but down 2.3% over the past month, while still showing gains of 45.4% year to date and 45.0% over the last year, and 122.4% and 394.6% over the past 3 and 5 years.
- Investors have been digesting a steady stream of news around McKesson's role in pharmaceutical distribution and healthcare technology, along with evolving expectations for drug demand and supply chain resilience. These themes have helped shape the narrative that McKesson is a critical behind the scenes player in US healthcare, which in turn influences how the market is pricing its long term prospects.
- Right now, McKesson scores a 4/6 valuation score, suggesting it screens as undervalued on most of the checks we run, but not all of them. Next we will break down those different valuation approaches, before finishing with a more holistic way to think about what the stock is truly worth.
Approach 1: McKesson Discounted Cash Flow (DCF) Analysis
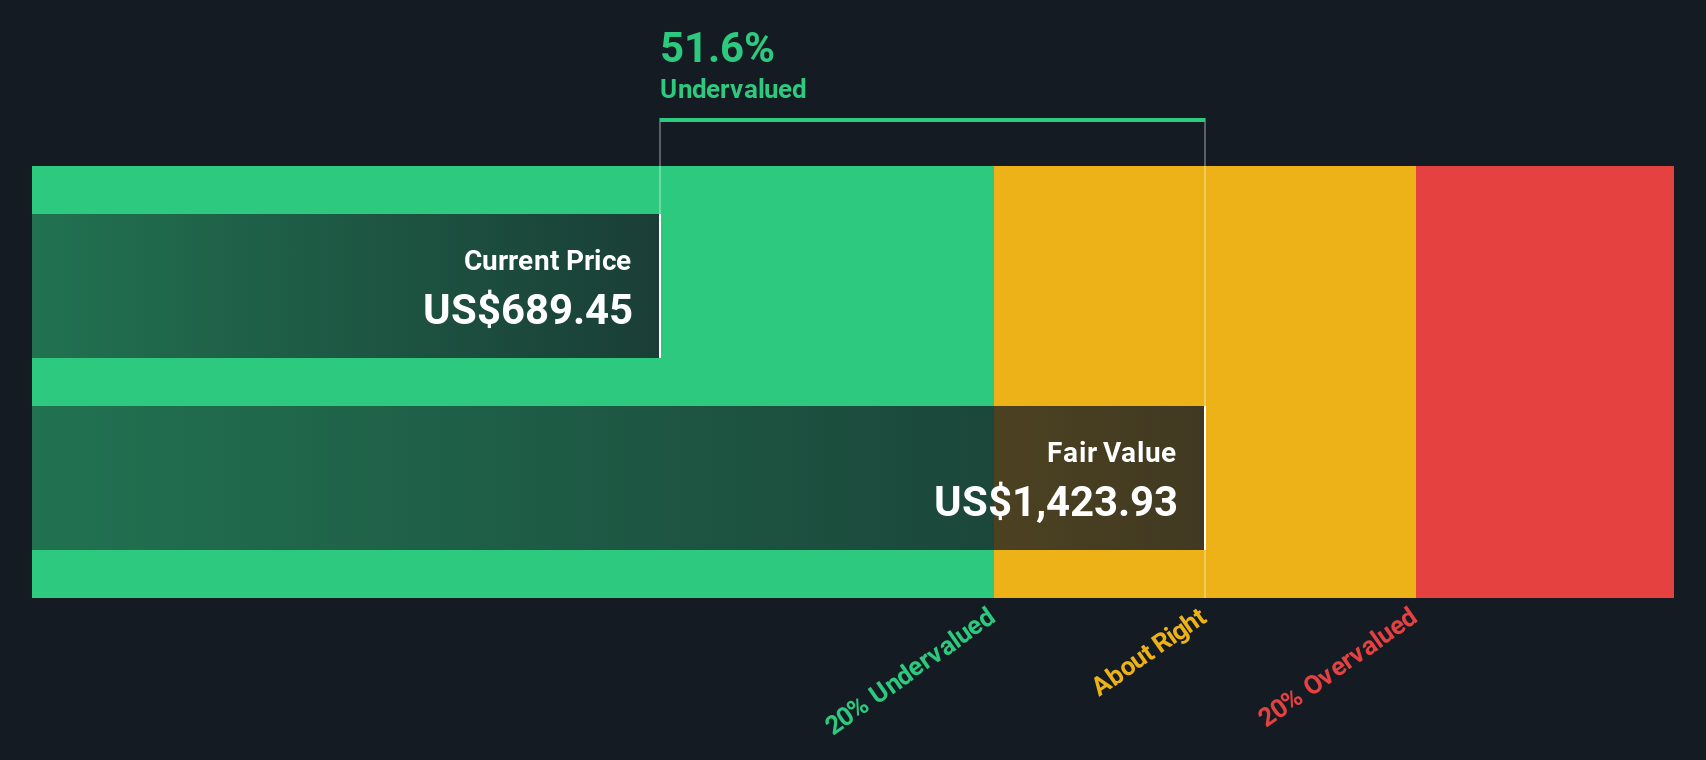
A Discounted Cash Flow model estimates what a company is worth by projecting the cash it can generate in the future, then discounting those cash flows back to today in dollar terms. For McKesson, the latest twelve month Free Cash Flow is about $6.0 billion, and analysts see this rising steadily as the business scales.
Based on a 2 Stage Free Cash Flow to Equity model, Simply Wall St uses analyst forecasts for the next few years, then extrapolates beyond that. Under these assumptions, McKesson's Free Cash Flow is projected to grow to roughly $8.7 billion by 2035. When all those future cash flows are discounted back, the estimated intrinsic value comes out at about $1,399 per share.
Compared with the recent share price around $823, the DCF suggests the stock may be trading below this estimated intrinsic value, indicating the market may not be fully pricing in McKesson's cash generation potential under these assumptions.
Result: Potentially undervalued based on this DCF model
Our Discounted Cash Flow (DCF) analysis suggests McKesson is undervalued by 41.2%. Track this in your watchlist or portfolio, or discover 906 more undervalued stocks based on cash flows.
Approach 2: McKesson Price vs Earnings
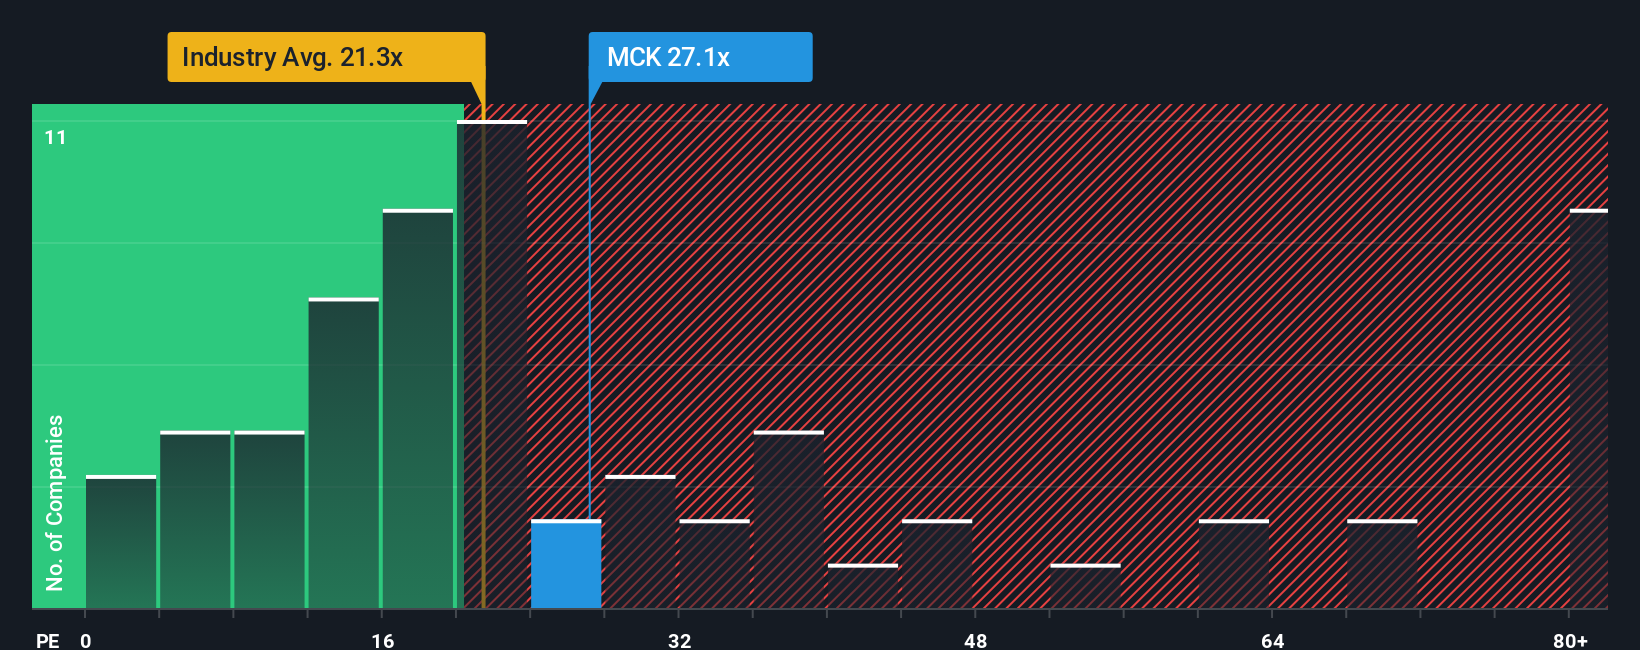
For profitable businesses like McKesson, the Price to Earnings ratio is a straightforward way to see what investors are paying for each dollar of current earnings. A higher PE can sometimes be associated with expectations of faster growth or lower risk, while slower growth or higher uncertainty usually align with a lower, more conservative PE.
McKesson currently trades on about 25.2x earnings. This is below both the broader Healthcare industry average of roughly 23.9x and the peer group average of around 28.5x. Simply Wall St also calculates a proprietary Fair Ratio of about 33.0x for McKesson, which reflects what its PE might reasonably be given its earnings growth outlook, margins, industry position, market cap and specific risks.
This Fair Ratio can be more insightful than simple peer or industry comparisons, because it adjusts for the company’s fundamentals rather than assuming one size fits all. With McKesson trading at 25.2x compared with a Fair Ratio of 33.0x, the shares appear to be attractively priced on an earnings basis.
Result: UNDERVALUED
PE ratios tell one story, but what if the real opportunity lies elsewhere? Discover 1447 companies where insiders are betting big on explosive growth.
Upgrade Your Decision Making: Choose your McKesson Narrative
Earlier we mentioned that there is an even better way to understand valuation, so let's introduce you to Narratives, a simple framework that lets you attach a clear story about McKesson's future to concrete numbers like expected revenue growth, margins, earnings and a fair value estimate, then see how that stacks up against today's share price. On Simply Wall St's Community page, Narratives are an accessible tool used by millions of investors to link what they believe about a business, such as McKesson gaining share in specialty oncology or facing mounting regulatory pressure, directly to a financial forecast and a resulting fair value that updates automatically as new news, earnings or guidance arrives. With McKesson for example, one Narrative might lean bullish and point to a fair value closer to the upper analyst target of about $830, while a more cautious Narrative might anchor around the lower $640 target, and by comparing each Narrative's fair value to the current market price you can decide whether it looks like a buy, hold or sell based on the story you actually believe.
Do you think there's more to the story for McKesson? Head over to our Community to see what others are saying!

This article by Simply Wall St is general in nature. We provide commentary based on historical data and analyst forecasts only using an unbiased methodology and our articles are not intended to be financial advice. It does not constitute a recommendation to buy or sell any stock, and does not take account of your objectives, or your financial situation. We aim to bring you long-term focused analysis driven by fundamental data. Note that our analysis may not factor in the latest price-sensitive company announcements or qualitative material. Simply Wall St has no position in any stocks mentioned.
Have feedback on this article? Concerned about the content? Get in touch with us directly. Alternatively, email editorial-team@simplywallst.com