
- PREMIUM
- LIVE QUOTES
- INSTITUTIONS
 Index Options
 State Street
 CME Group
 Nasdaq
 Cboe
Cboe TradingView
 Wall Street Journal
Is Trip.com Still Attractive After a 10% Rise Amid Global Travel Recovery?
- Wondering if Trip.com Group is still a smart way to play the travel recovery, or if most of the upside is already priced in? Let us unpack what the current share price is really implying about future growth.
- The stock has climbed 10.2% year to date to around $71.39, but it is still down 3.9% over the last year and roughly flat over the last month, suggesting investors are undecided about the next leg of the story.
- Sentiment has been shaped by ongoing recovery in global travel demand and Trip.com's efforts to expand internationally, from strengthening its overseas brands to deepening partnerships with airlines and hotels. At the same time, investors are weighing macro headwinds and competition from other online travel platforms, which helps explain the more cautious trading in recent weeks.
- Despite that mixed backdrop, Trip.com Group currently scores a 6/6 valuation score. This signals it screens as undervalued across all our standard checks. Next, we will break down the different valuation approaches, before finishing with a more intuitive way to think about what the market might be missing.
Find out why Trip.com Group's -3.9% return over the last year is lagging behind its peers.
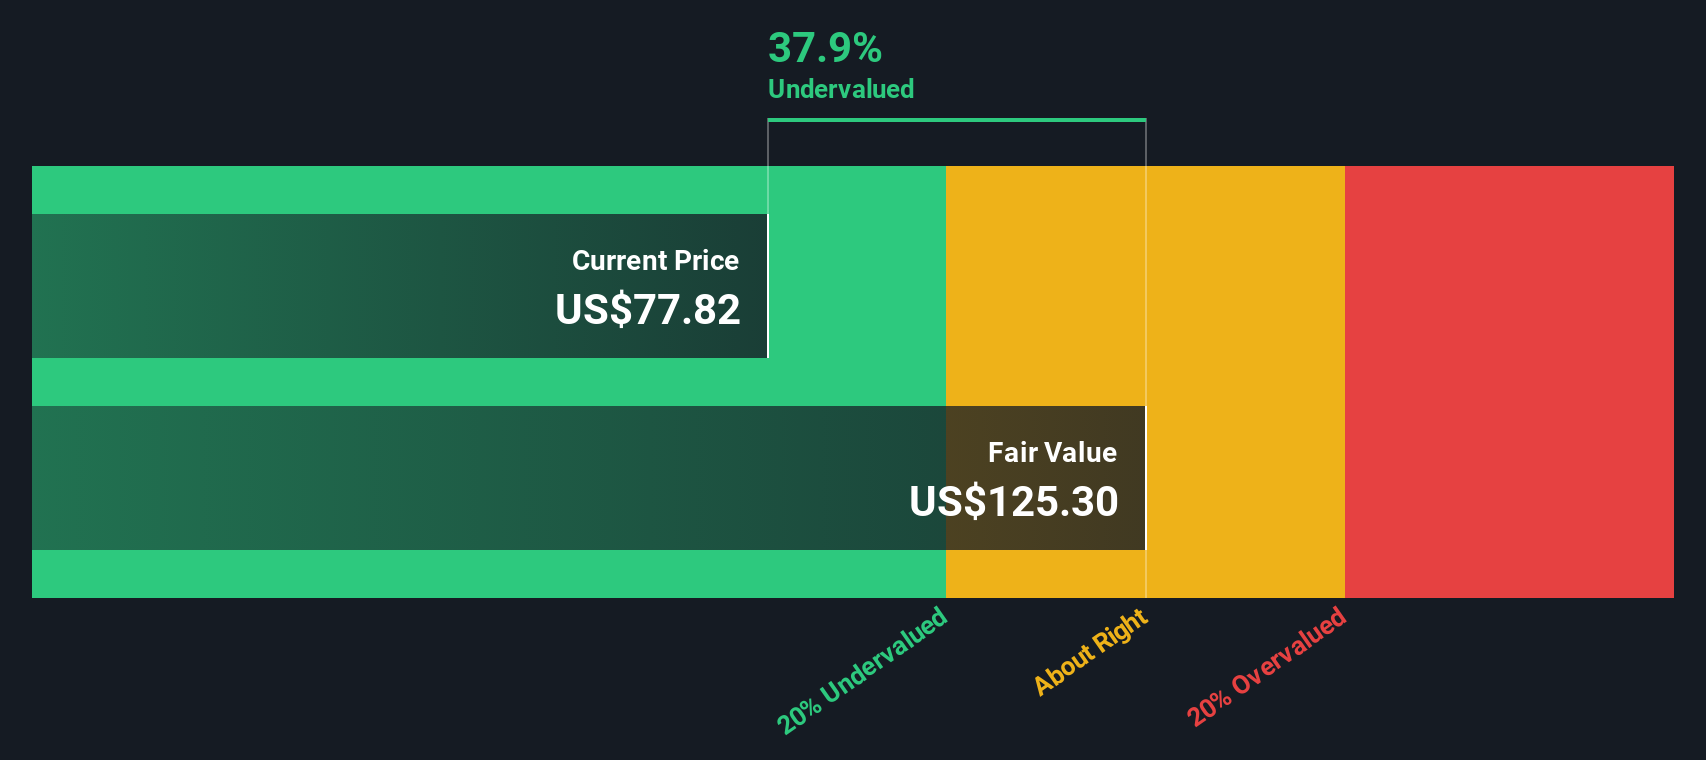
Approach 1: Trip.com Group Discounted Cash Flow (DCF) Analysis
A Discounted Cash Flow model estimates what a company is worth by projecting the cash it can generate in the future and discounting those cash flows back to today.
For Trip.com Group, the latest twelve month free cash flow stands at roughly CN¥19.0 billion. Analysts provide detailed forecasts for the next few years, and beyond that Simply Wall St extrapolates growth to build a 10 year view. Under this two stage Free Cash Flow to Equity model, Trip.com’s free cash flow is expected to rise gradually to around CN¥34.0 billion by 2035, reflecting a solid but moderating growth profile as the business matures.
When those projected cash flows are discounted back to the present in CN¥ terms, the model produces an intrinsic value equivalent to about $110.58 per share, versus a current market price around $71.39. That implies the stock trades at roughly a 35.4% discount to its estimated fair value, suggesting the market is pricing in a much weaker long term trajectory than the cash flow forecasts indicate.
Result: UNDERVALUED
Our Discounted Cash Flow (DCF) analysis suggests Trip.com Group is undervalued by 35.4%. Track this in your watchlist or portfolio, or discover 906 more undervalued stocks based on cash flows.
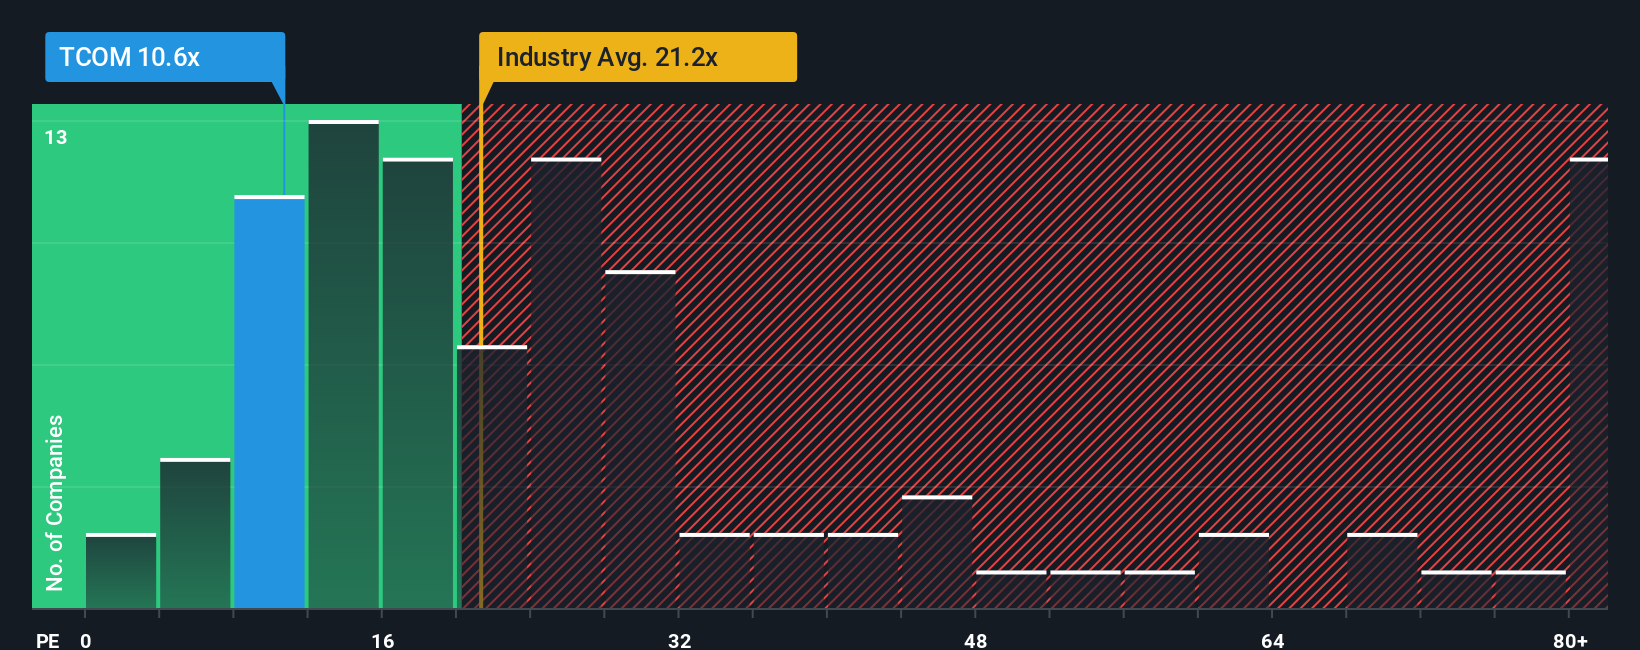
Approach 2: Trip.com Group Price vs Earnings
For a profitable and relatively mature platform like Trip.com Group, the price to earnings (PE) ratio is a practical way to gauge how much investors are paying for each dollar of current profits. In general, companies with stronger and more reliable earnings growth, and lower perceived risk, can justify higher PE multiples, while slower growth or higher uncertainty should translate into lower PE levels.
Trip.com currently trades on a PE of about 10.5x, which is well below both the Hospitality industry average of roughly 23.1x and the broader peer average of around 26.7x. Simply Wall St’s proprietary Fair Ratio framework goes a step further than these simple comparisons by estimating what PE multiple would be reasonable for Trip.com given its specific earnings growth outlook, risk profile, profit margins, industry positioning and market cap. For Trip.com, that Fair Ratio sits near 14.3x. This means the stock trades at a discount to where it might reasonably sit based on its fundamentals, rather than on crude peer comparisons alone.
Result: UNDERVALUED
PE ratios tell one story, but what if the real opportunity lies elsewhere? Discover 1447 companies where insiders are betting big on explosive growth.
Upgrade Your Decision Making: Choose your Trip.com Group Narrative
Earlier we mentioned that there is an even better way to understand valuation, so let us introduce you to Narratives, a simple way to connect your view of Trip.com Group’s business to a set of forecasts and a fair value so you can clearly see whether you think the stock is worth more or less than its current price.
A Narrative is your story behind the numbers, where you spell out what you believe about future revenue, earnings and margins, and the Simply Wall St platform then turns that story into a dynamic financial forecast and an implied fair value you can compare directly with today’s share price to help guide your investment decisions.
On Simply Wall St’s Community page, used by millions of investors, Narratives are easy to create, compare and update. Because they automatically refresh when new information such as earnings releases or major news arrives, your Trip.com view stays live rather than static.
For Trip.com Group, one investor might build a bullish Narrative that assumes outbound Asia travel accelerates, margins stay resilient and fair value sits closer to about $97 per share. A more cautious investor might focus on competition, geopolitical risks and softer pricing, landing nearer $70 as a fair value and therefore a much more conservative stance on potential upside.
Do you think there's more to the story for Trip.com Group? Head over to our Community to see what others are saying!

This article by Simply Wall St is general in nature. We provide commentary based on historical data and analyst forecasts only using an unbiased methodology and our articles are not intended to be financial advice. It does not constitute a recommendation to buy or sell any stock, and does not take account of your objectives, or your financial situation. We aim to bring you long-term focused analysis driven by fundamental data. Note that our analysis may not factor in the latest price-sensitive company announcements or qualitative material. Simply Wall St has no position in any stocks mentioned.
Have feedback on this article? Concerned about the content? Get in touch with us directly. Alternatively, email editorial-team@simplywallst.com