
- PREMIUM
- LIVE QUOTES
- INSTITUTIONS
 Index Options
 State Street
 CME Group
 Nasdaq
 Cboe
Cboe TradingView
 Wall Street Journal
Karman Holdings (KRMN): Rethinking Valuation After a 126% Year-to-Date Share Price Surge
Karman Holdings (KRMN) has quietly turned into one of this year’s stronger industrial stories, with the stock up about 126% year to date and another 13% over the past month.
See our latest analysis for Karman Holdings.
That surge has come as investors warm to Karman’s role in high priority defense and space programs, with a 1 month share price return near 13% reinforcing a clear upward momentum trend this year from a modest recent pullback at $68.06.
If Karman’s run has you rethinking what else might be gaining traction in defense and space, it is a good moment to explore aerospace and defense stocks as potential next ideas.
With revenue and earnings expanding rapidly and shares still trading roughly 23 percent below consensus targets, is Karman a high growth defense winner still mispriced, or are markets already pricing in the next leg of upside?
Price-to-Sales of 21x, Is it justified?
On a price-to-sales basis, Karman’s $68.06 share price implies a rich 21x sales multiple, placing it well above typical aerospace and defense peers.
The price-to-sales ratio compares the company’s market value to its annual revenue, a useful gauge for fast growing names where profits are still developing. For Karman, investors appear willing to pay a premium multiple for exposure to hypersonics, missile defense and space launch platforms, despite currently modest margins.
That premium is sizable, with Karman trading on 21x sales versus a US Aerospace and Defense industry average of about 3.1x and a peer average near 4.9x. It also sits well above an estimated fair price-to-sales ratio of 5.1x. This suggests the market is already pricing in a powerful step change in growth and profitability rather than merely catching up to current fundamentals.
Explore the SWS fair ratio for Karman Holdings
Result: Price-to-Sales of 21x (OVERVALUED)
However, sustained multiple expansion is not guaranteed, because execution missteps or delays in key hypersonic and missile defense programs could undermine today’s growth expectations.
Find out about the key risks to this Karman Holdings narrative.
Another View on Valuation
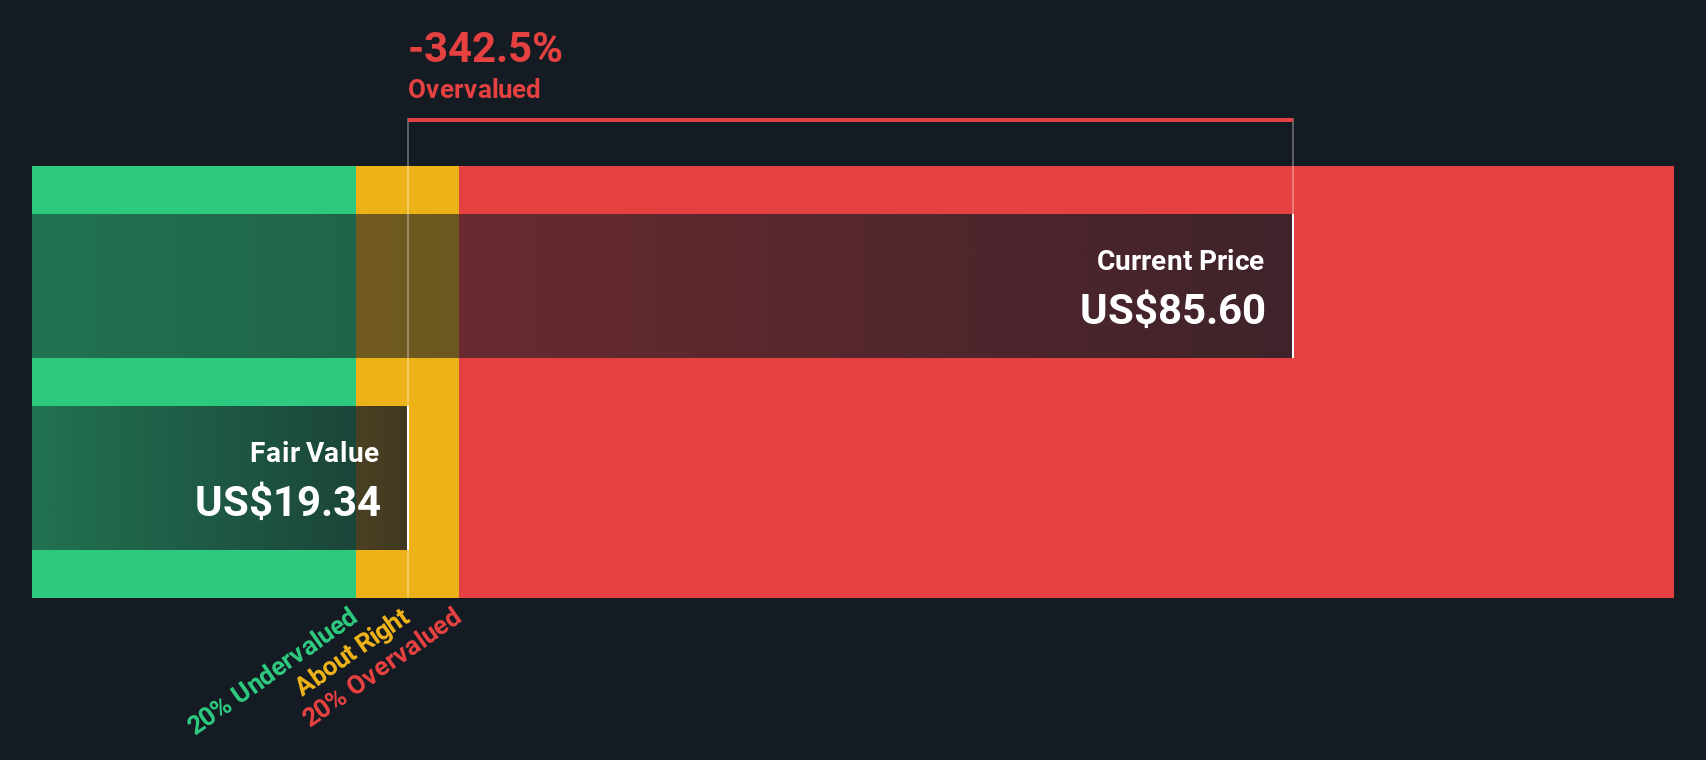
Our DCF model paints an even starker picture, putting Karman’s fair value near $27.19 per share, well below the current $68.06 level. That suggests the stock may be materially overvalued on cash flow terms and raises the question: how much future success is already priced in?
Look into how the SWS DCF model arrives at its fair value.
Simply Wall St performs a discounted cash flow (DCF) on every stock in the world every day (check out Karman Holdings for example). We show the entire calculation in full. You can track the result in your watchlist or portfolio and be alerted when this changes, or use our stock screener to discover 908 undervalued stocks based on their cash flows. If you save a screener we even alert you when new companies match - so you never miss a potential opportunity.
Build Your Own Karman Holdings Narrative
If you see things differently or want to dig into the numbers yourself, you can build a personalized view of Karman in just minutes: Do it your way.
A great starting point for your Karman Holdings research is our analysis highlighting 3 key rewards and 3 important warning signs that could impact your investment decision.
Ready for your next smart move?
Do not stop at Karman. Sharpen your edge by using the Simply Wall St Screener to spot fresh opportunities before the crowd locks them up.
- Capture potential multi-baggers early by targeting these 3613 penny stocks with strong financials that already show stronger balance sheets and fundamentals than typical speculative names.
- Ride powerful technology shifts by focusing on these 26 AI penny stocks positioned at the intersection of artificial intelligence and real, scalable business models.
- Identify value opportunities by zeroing in on these 908 undervalued stocks based on cash flows where solid cash flows and sensible prices still line up for investors who prioritize fundamentals.
This article by Simply Wall St is general in nature. We provide commentary based on historical data and analyst forecasts only using an unbiased methodology and our articles are not intended to be financial advice. It does not constitute a recommendation to buy or sell any stock, and does not take account of your objectives, or your financial situation. We aim to bring you long-term focused analysis driven by fundamental data. Note that our analysis may not factor in the latest price-sensitive company announcements or qualitative material. Simply Wall St has no position in any stocks mentioned.
Have feedback on this article? Concerned about the content? Get in touch with us directly. Alternatively, email editorial-team@simplywallst.com