
- PREMIUM
- LIVE QUOTES
- INSTITUTIONS
 Index Options
 State Street
 CME Group
 Nasdaq
 Cboe
Cboe TradingView
 Wall Street Journal
Hogy Medical Co.,Ltd.'s (TSE:3593) high institutional ownership speaks for itself as stock continues to impress, up 18% over last week
Key Insights
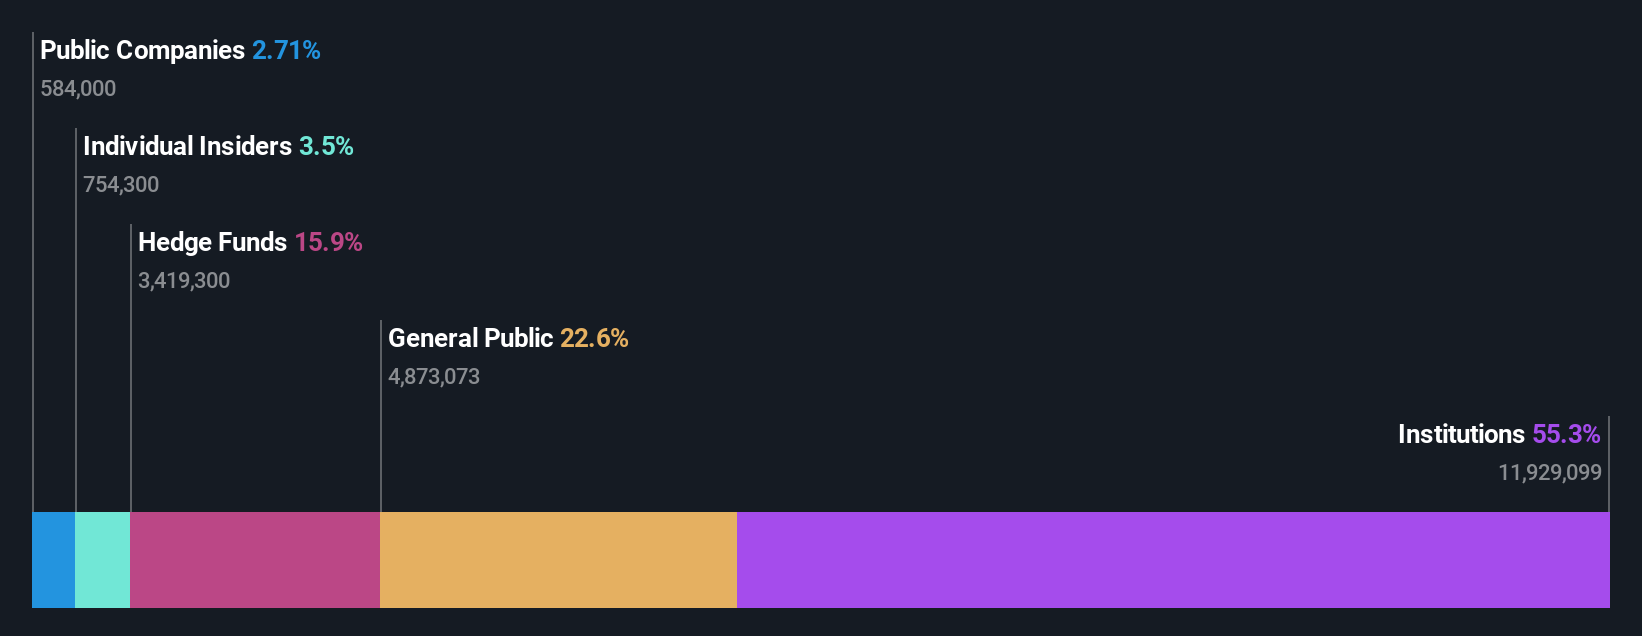
- Significantly high institutional ownership implies Hogy MedicalLtd's stock price is sensitive to their trading actions
- The top 7 shareholders own 52% of the company
- Using data from analyst forecasts alongside ownership research, one can better assess the future performance of a company
If you want to know who really controls Hogy Medical Co.,Ltd. (TSE:3593), then you'll have to look at the makeup of its share registry. With 55% stake, institutions possess the maximum shares in the company. Put another way, the group faces the maximum upside potential (or downside risk).
Last week’s 18% gain means that institutional investors were on the positive end of the spectrum even as the company has shown strong longer-term trends. The one-year return on investment is currently 43% and last week's gain would have been more than welcomed.
Let's delve deeper into each type of owner of Hogy MedicalLtd, beginning with the chart below.
Check out our latest analysis for Hogy MedicalLtd
What Does The Institutional Ownership Tell Us About Hogy MedicalLtd?
Institutions typically measure themselves against a benchmark when reporting to their own investors, so they often become more enthusiastic about a stock once it's included in a major index. We would expect most companies to have some institutions on the register, especially if they are growing.
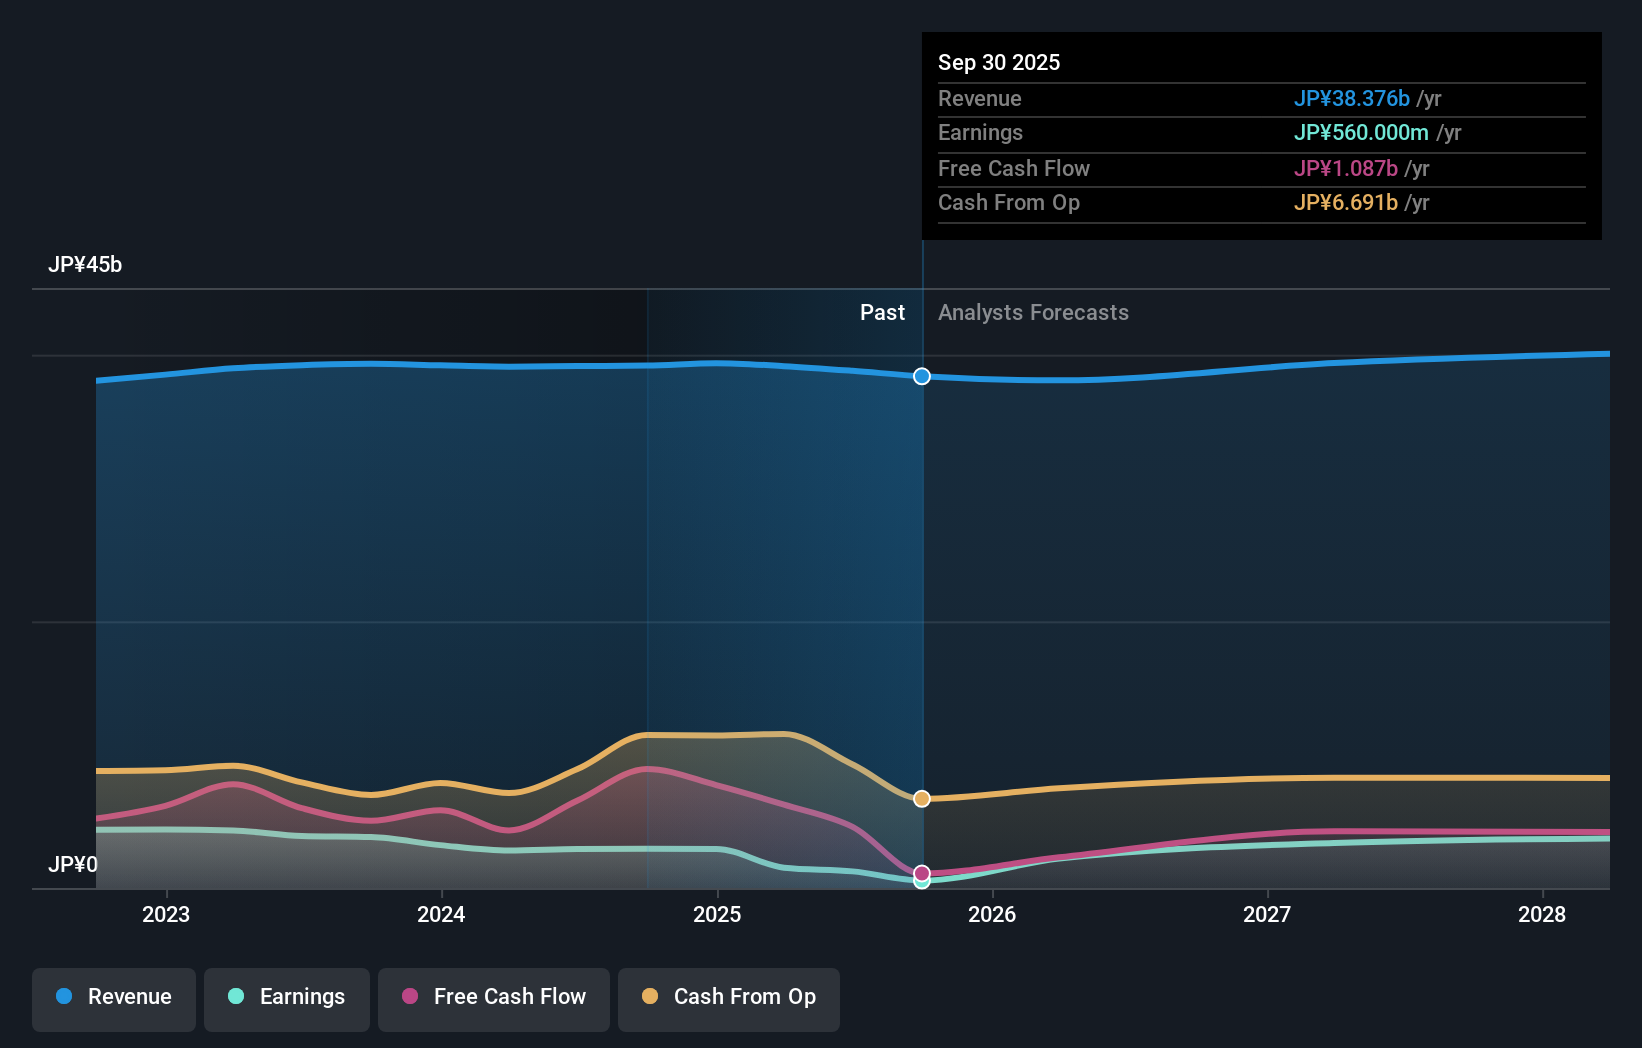
Hogy MedicalLtd already has institutions on the share registry. Indeed, they own a respectable stake in the company. This suggests some credibility amongst professional investors. But we can't rely on that fact alone since institutions make bad investments sometimes, just like everyone does. It is not uncommon to see a big share price drop if two large institutional investors try to sell out of a stock at the same time. So it is worth checking the past earnings trajectory of Hogy MedicalLtd, (below). Of course, keep in mind that there are other factors to consider, too.
Institutional investors own over 50% of the company, so together than can probably strongly influence board decisions. It would appear that 16% of Hogy MedicalLtd shares are controlled by hedge funds. That worth noting, since hedge funds are often quite active investors, who may try to influence management. Many want to see value creation (and a higher share price) in the short term or medium term. The company's largest shareholder is Dalton Investments, Inc., with ownership of 16%. Grantham Mayo Van Otterloo & Co. LLC is the second largest shareholder owning 10% of common stock, and Rising Sun Management Ltd. holds about 9.0% of the company stock.
We also observed that the top 7 shareholders account for more than half of the share register, with a few smaller shareholders to balance the interests of the larger ones to a certain extent.
While studying institutional ownership for a company can add value to your research, it is also a good practice to research analyst recommendations to get a deeper understand of a stock's expected performance. There are plenty of analysts covering the stock, so it might be worth seeing what they are forecasting, too.
Insider Ownership Of Hogy MedicalLtd
The definition of an insider can differ slightly between different countries, but members of the board of directors always count. Company management run the business, but the CEO will answer to the board, even if he or she is a member of it.
I generally consider insider ownership to be a good thing. However, on some occasions it makes it more difficult for other shareholders to hold the board accountable for decisions.
We can see that insiders own shares in Hogy Medical Co.,Ltd.. In their own names, insiders own JP¥5.1b worth of stock in the JP¥146b company. Some would say this shows alignment of interests between shareholders and the board. But it might be worth checking if those insiders have been selling.
General Public Ownership
The general public-- including retail investors -- own 23% stake in the company, and hence can't easily be ignored. This size of ownership, while considerable, may not be enough to change company policy if the decision is not in sync with other large shareholders.
Next Steps:
It's always worth thinking about the different groups who own shares in a company. But to understand Hogy MedicalLtd better, we need to consider many other factors. To that end, you should be aware of the 3 warning signs we've spotted with Hogy MedicalLtd .
Ultimately the future is most important. You can access this free report on analyst forecasts for the company.
NB: Figures in this article are calculated using data from the last twelve months, which refer to the 12-month period ending on the last date of the month the financial statement is dated. This may not be consistent with full year annual report figures.
Have feedback on this article? Concerned about the content? Get in touch with us directly. Alternatively, email editorial-team (at) simplywallst.com.
This article by Simply Wall St is general in nature. We provide commentary based on historical data and analyst forecasts only using an unbiased methodology and our articles are not intended to be financial advice. It does not constitute a recommendation to buy or sell any stock, and does not take account of your objectives, or your financial situation. We aim to bring you long-term focused analysis driven by fundamental data. Note that our analysis may not factor in the latest price-sensitive company announcements or qualitative material. Simply Wall St has no position in any stocks mentioned.