
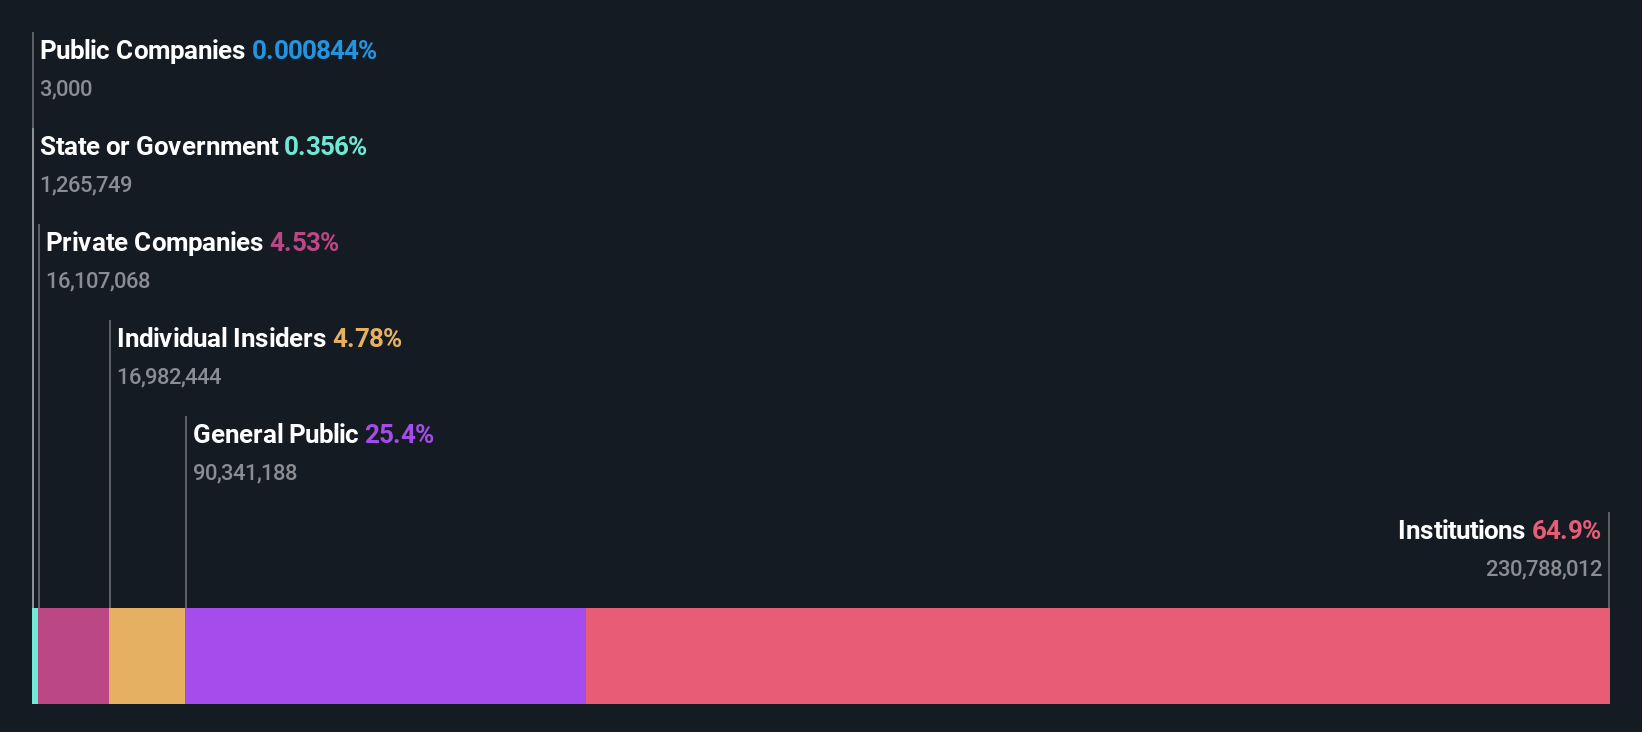
Trent Limited (NSE:TRENT) is largely controlled by institutional shareholders who own 65% of the company
Key Insights
- Institutions' substantial holdings in Trent implies that they have significant influence over the company's share price
- The top 7 shareholders own 52% of the company
- Analyst forecasts along with ownership data serve to give a strong idea about prospects for a business
If you want to know who really controls Trent Limited (NSE:TRENT), then you'll have to look at the makeup of its share registry. We can see that institutions own the lion's share in the company with 65% ownership. Put another way, the group faces the maximum upside potential (or downside risk).
Given the vast amount of money and research capacities at their disposal, institutional ownership tends to carry a lot of weight, especially with individual investors. Therefore, a good portion of institutional money invested in the company is usually a huge vote of confidence on its future.
Let's take a closer look to see what the different types of shareholders can tell us about Trent.
View our latest analysis for Trent
What Does The Institutional Ownership Tell Us About Trent?
Institutions typically measure themselves against a benchmark when reporting to their own investors, so they often become more enthusiastic about a stock once it's included in a major index. We would expect most companies to have some institutions on the register, especially if they are growing.
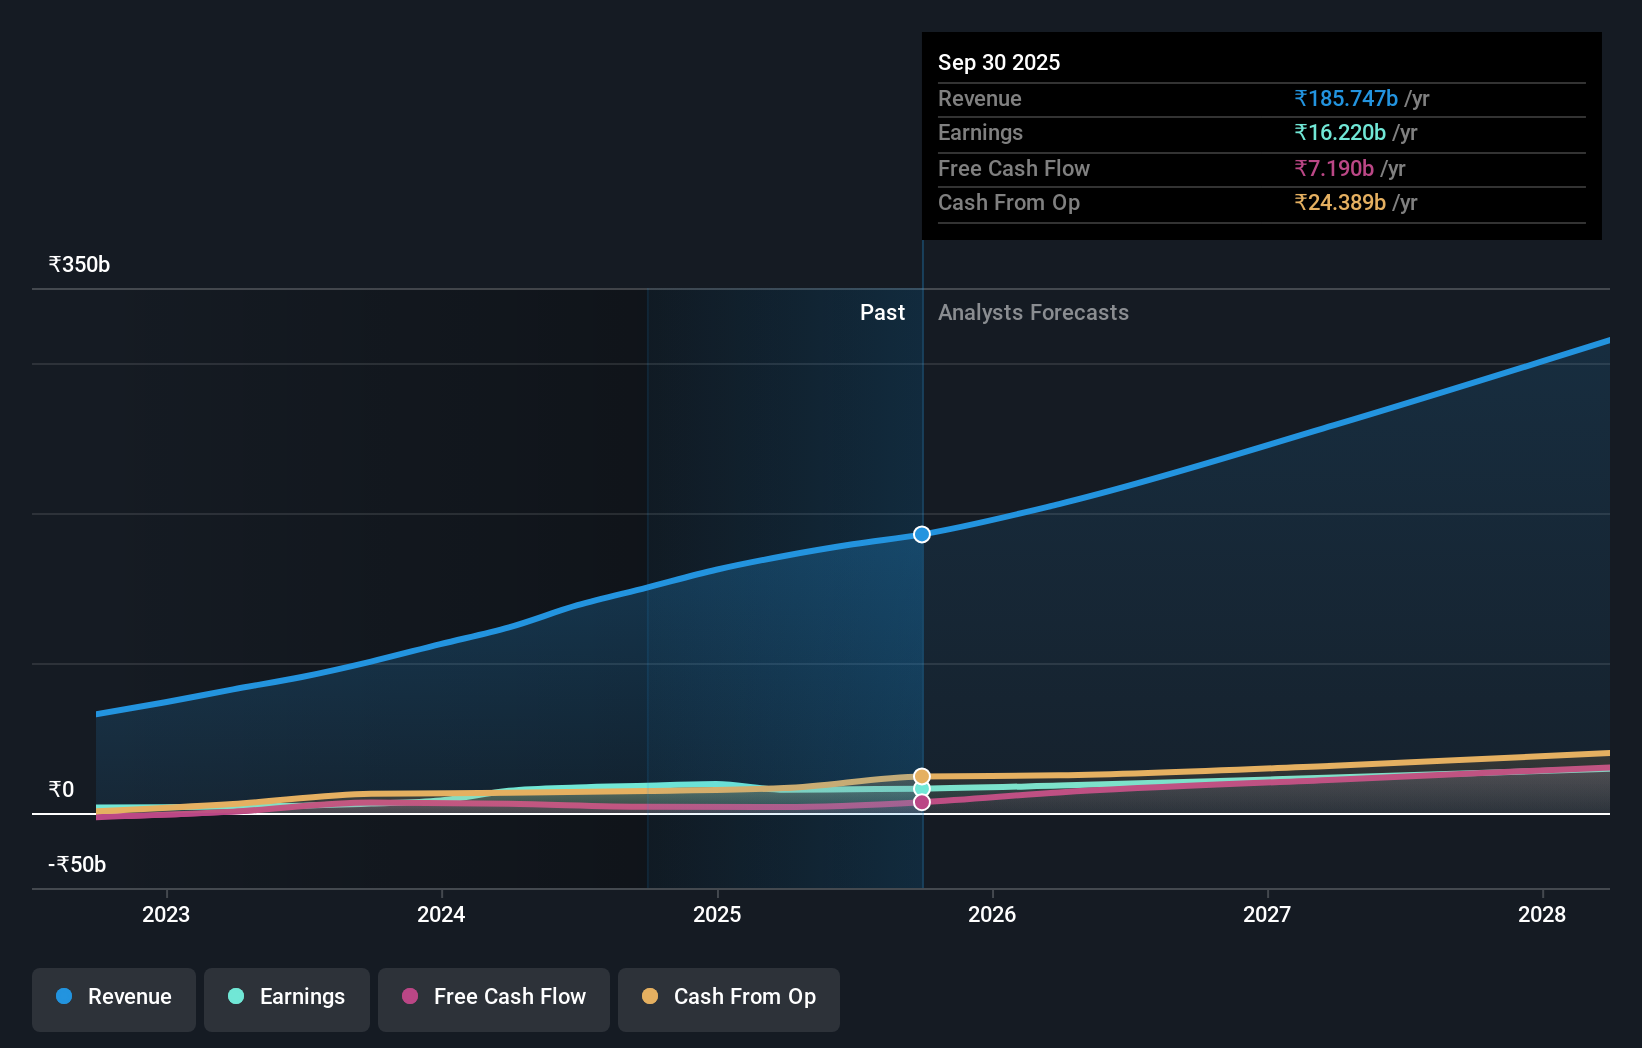
As you can see, institutional investors have a fair amount of stake in Trent. This implies the analysts working for those institutions have looked at the stock and they like it. But just like anyone else, they could be wrong. If multiple institutions change their view on a stock at the same time, you could see the share price drop fast. It's therefore worth looking at Trent's earnings history below. Of course, the future is what really matters.
Investors should note that institutions actually own more than half the company, so they can collectively wield significant power. Hedge funds don't have many shares in Trent. Tata Sons Private Limited is currently the largest shareholder, with 32% of shares outstanding. For context, the second largest shareholder holds about 4.5% of the shares outstanding, followed by an ownership of 4.3% by the third-largest shareholder.
We did some more digging and found that 7 of the top shareholders account for roughly 52% of the register, implying that along with larger shareholders, there are a few smaller shareholders, thereby balancing out each others interests somewhat.
While studying institutional ownership for a company can add value to your research, it is also a good practice to research analyst recommendations to get a deeper understand of a stock's expected performance. There are a reasonable number of analysts covering the stock, so it might be useful to find out their aggregate view on the future.
Insider Ownership Of Trent
While the precise definition of an insider can be subjective, almost everyone considers board members to be insiders. Company management run the business, but the CEO will answer to the board, even if he or she is a member of it.
Insider ownership is positive when it signals leadership are thinking like the true owners of the company. However, high insider ownership can also give immense power to a small group within the company. This can be negative in some circumstances.
We can report that insiders do own shares in Trent Limited. It is a very large company, and board members collectively own ₹70b worth of shares (at current prices). It is good to see this level of investment. You can check here to see if those insiders have been buying recently.
General Public Ownership
The general public-- including retail investors -- own 25% stake in the company, and hence can't easily be ignored. This size of ownership, while considerable, may not be enough to change company policy if the decision is not in sync with other large shareholders.
Private Company Ownership
We can see that Private Companies own 4.5%, of the shares on issue. Private companies may be related parties. Sometimes insiders have an interest in a public company through a holding in a private company, rather than in their own capacity as an individual. While it's hard to draw any broad stroke conclusions, it is worth noting as an area for further research.
Next Steps:
While it is well worth considering the different groups that own a company, there are other factors that are even more important.
I like to dive deeper into how a company has performed in the past. You can find historic revenue and earnings in this detailed graph.
If you are like me, you may want to think about whether this company will grow or shrink. Luckily, you can check this free report showing analyst forecasts for its future.
NB: Figures in this article are calculated using data from the last twelve months, which refer to the 12-month period ending on the last date of the month the financial statement is dated. This may not be consistent with full year annual report figures.
Have feedback on this article? Concerned about the content? Get in touch with us directly. Alternatively, email editorial-team (at) simplywallst.com.
This article by Simply Wall St is general in nature. We provide commentary based on historical data and analyst forecasts only using an unbiased methodology and our articles are not intended to be financial advice. It does not constitute a recommendation to buy or sell any stock, and does not take account of your objectives, or your financial situation. We aim to bring you long-term focused analysis driven by fundamental data. Note that our analysis may not factor in the latest price-sensitive company announcements or qualitative material. Simply Wall St has no position in any stocks mentioned.