
Is Alcon Becoming a Bargain After Product Expansion and a 17.2% Year to Date Slide?
- If you have been wondering whether Alcon is quietly turning into a bargain or just a value trap, you are not alone. This article is going to unpack what the current share price is really implying.
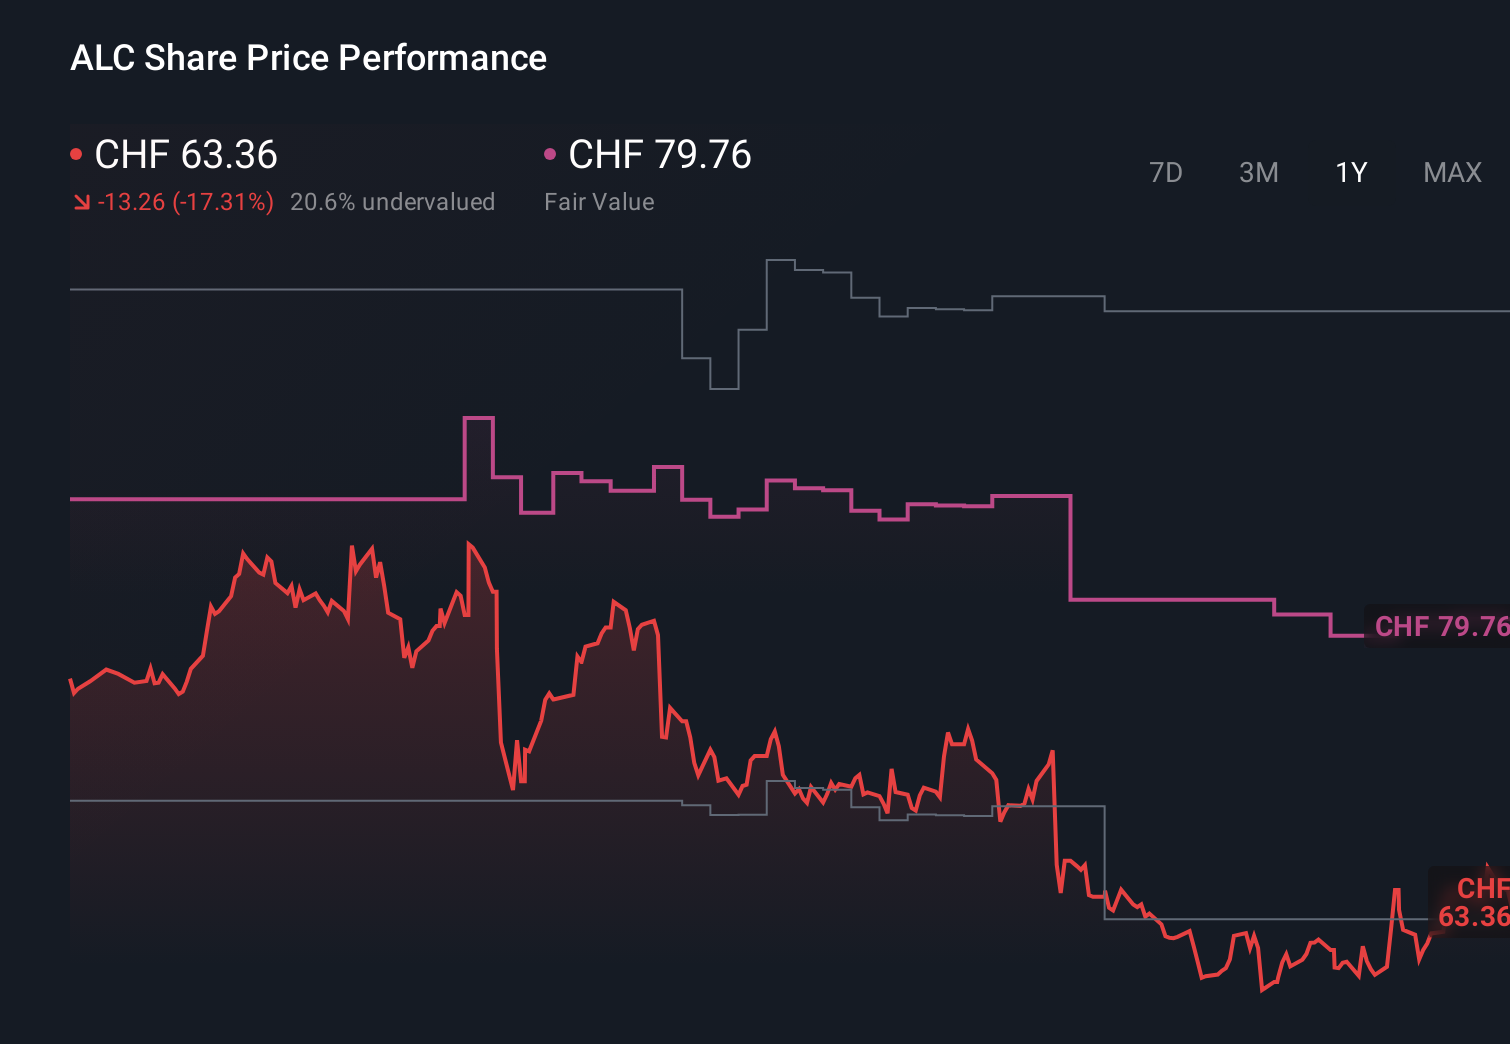
- The stock has slipped about 1.6% over the last week but is still up 2.5% over the past month, while longer term returns of about 2.1% over three years and 13.8% over five years show a much slower burn than many investors hoped for after a year to date drop of 17.2% and a 16.1% slide over the last year.
- Recent headlines have focused on Alcon's ongoing expansion of its surgical and vision care portfolios, including new product launches and regulatory approvals that aim to deepen its moat in ophthalmology. At the same time, broader healthcare sector rotation and shifting risk appetites have weighed on defensive names like Alcon, helping explain why the share price has lagged even as the business continues to invest for growth.
- On our framework, Alcon posts a valuation score of 4 out of 6, suggesting pockets of undervaluation that traditional multiples, discounted cash flow models, and peer comparisons only partly capture. By the end of this article we will look at a more intuitive way to tie all those methods together into a clearer view of what the stock is really worth.
Approach 1: Alcon Discounted Cash Flow (DCF) Analysis
A Discounted Cash Flow model estimates what a company is worth by projecting the cash it can generate in the future and then discounting those cash flows back to today, to reflect risk and the time value of money.
Alcon currently generates last twelve months free cash flow of about $1.29 billion, and analysts expect this to rise steadily as the business scales. Simply Wall St combines analyst forecasts for the next few years with longer term extrapolations, projecting free cash flow to reach roughly $2.83 billion by 2035 under a two stage Free Cash Flow to Equity model. These rising cash flows are then discounted back to today using an appropriate required return to estimate what the equity is worth now.
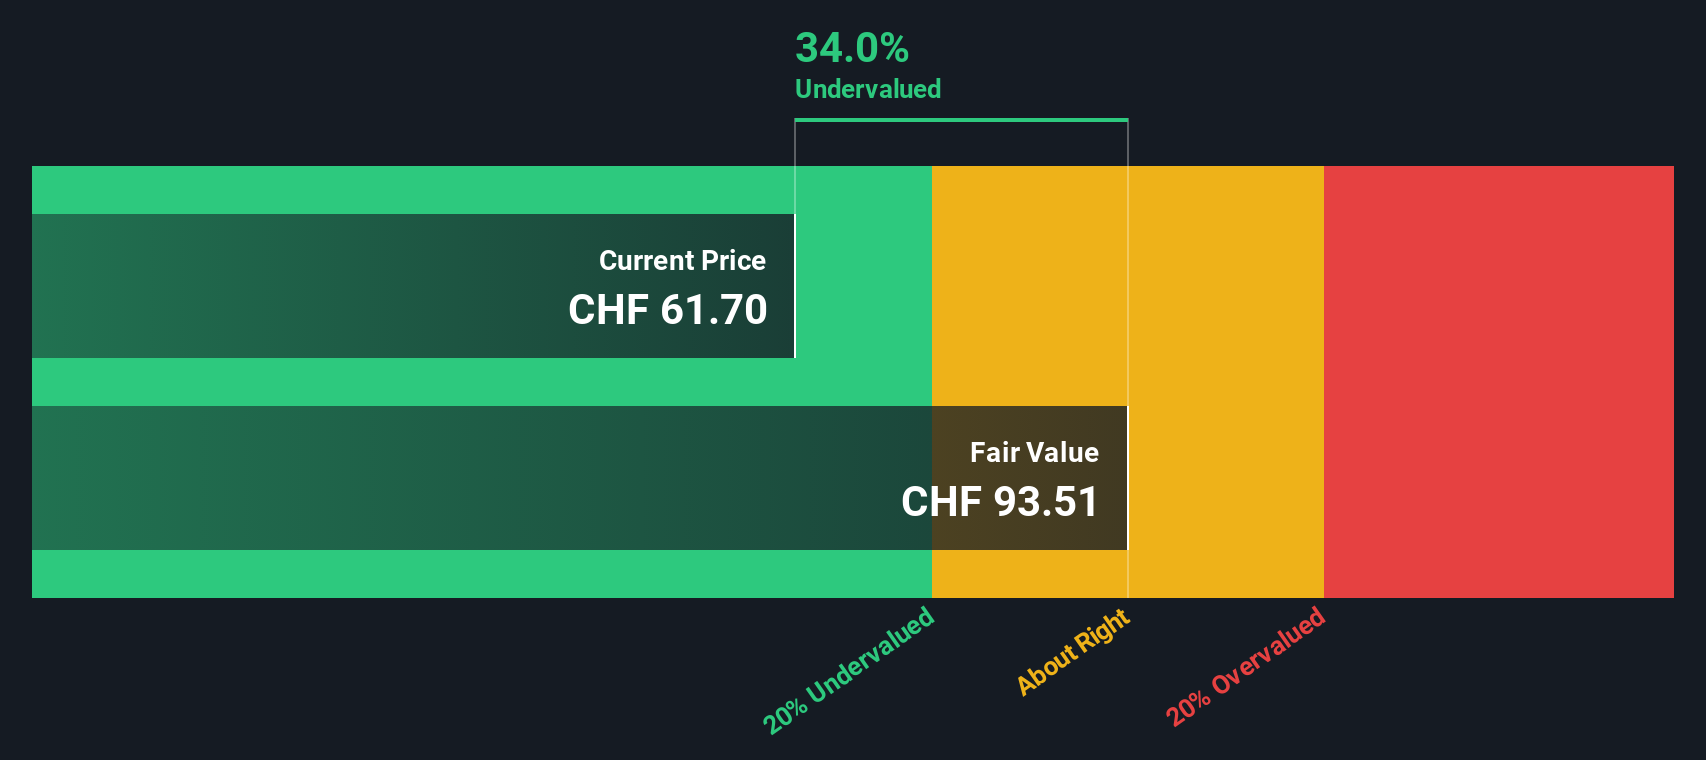
On this basis, the DCF model produces an intrinsic value of about $96.58 per share, implying the stock is trading at roughly a 34.5% discount to its estimated fair value. In other words, the current price reflects much lower growth and cash generation than the model assumes.
Result: UNDERVALUED
Our Discounted Cash Flow (DCF) analysis suggests Alcon is undervalued by 34.5%. Track this in your watchlist or portfolio, or discover 908 more undervalued stocks based on cash flows.
Approach 2: Alcon Price vs Earnings
For profitable companies like Alcon, the Price to Earnings (PE) ratio is a useful yardstick because it directly links what investors are paying for the stock to the profits the business is generating today.
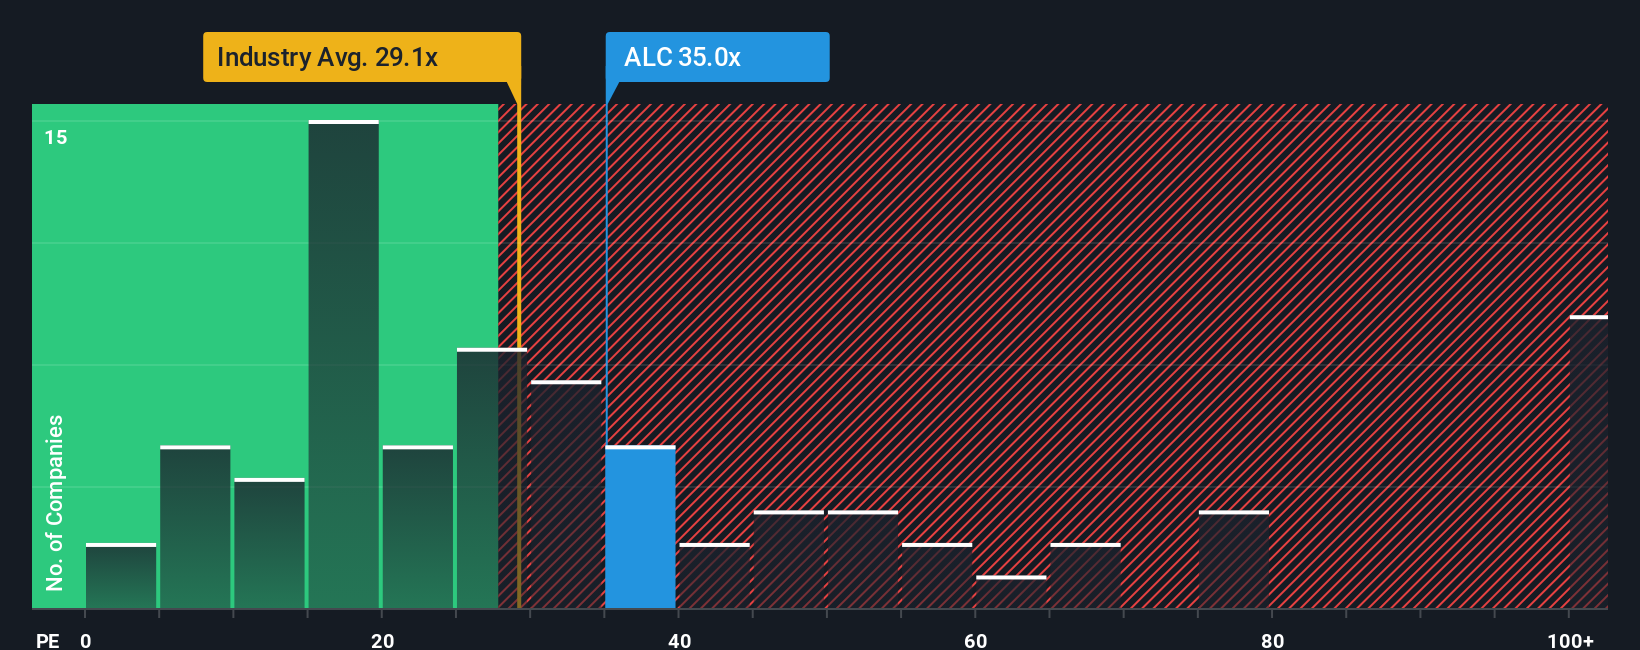
In general, higher growth and lower perceived risk justify a higher PE ratio, while slower growth or higher uncertainty argue for a lower, more conservative multiple. Alcon currently trades on a PE of about 37.26x, which is a premium to the Medical Equipment industry average of roughly 27.64x and also above the peer group average of around 24.73x.
Simply Wall St also calculates a Fair Ratio, a proprietary estimate of what Alcon’s PE should be given its earnings growth outlook, profitability, industry, market cap and risk profile. This Fair Ratio, at about 37.66x, goes beyond simple peer comparisons by explicitly accounting for the factors that actually drive what investors ought to pay for each dollar of earnings. Since Alcon’s current PE is slightly below this Fair Ratio, the stock screens as modestly undervalued on an earnings multiple basis.
Result: UNDERVALUED
PE ratios tell one story, but what if the real opportunity lies elsewhere? Discover 1446 companies where insiders are betting big on explosive growth.
Upgrade Your Decision Making: Choose your Alcon Narrative
Earlier we mentioned that there is an even better way to understand valuation, so let us introduce you to Narratives, a simple way to attach your own story about Alcon’s future to the numbers behind its fair value, including your assumptions for revenue growth, earnings and margins. A Narrative links three pieces together: the business story you believe, the financial forecast that flows from that story, and the fair value the forecast implies. It is built directly into Simply Wall St’s Community page, where millions of investors share and compare their views. Once you create or follow a Narrative, the platform continuously compares its Fair Value to Alcon’s current share price, helping you decide whether it looks like a buy, hold, or sell today, and automatically updates the valuation as new news, guidance and earnings reports come in. For example, one Alcon Narrative might lean bullish, expecting efficiency gains from UNITY VCS, steady margin expansion and a fair value close to the upper analyst target range. A more cautious Narrative could stress competitive pressure, integration risks and softer procedure growth to justify a fair value nearer the lowest target.
Do you think there's more to the story for Alcon? Head over to our Community to see what others are saying!
This article by Simply Wall St is general in nature. We provide commentary based on historical data and analyst forecasts only using an unbiased methodology and our articles are not intended to be financial advice. It does not constitute a recommendation to buy or sell any stock, and does not take account of your objectives, or your financial situation. We aim to bring you long-term focused analysis driven by fundamental data. Note that our analysis may not factor in the latest price-sensitive company announcements or qualitative material. Simply Wall St has no position in any stocks mentioned.
Have feedback on this article? Concerned about the content? Get in touch with us directly. Alternatively, email editorial-team@simplywallst.com