
- PREMIUM
- LIVE QUOTES
- INSTITUTIONS
 Index Options
 State Street
 CME Group
 Nasdaq
 Cboe
Cboe TradingView
 Wall Street Journal
Is TELUS Stock a Bargain After Its Recent 13.5% Slide and DCF Upside Potential?
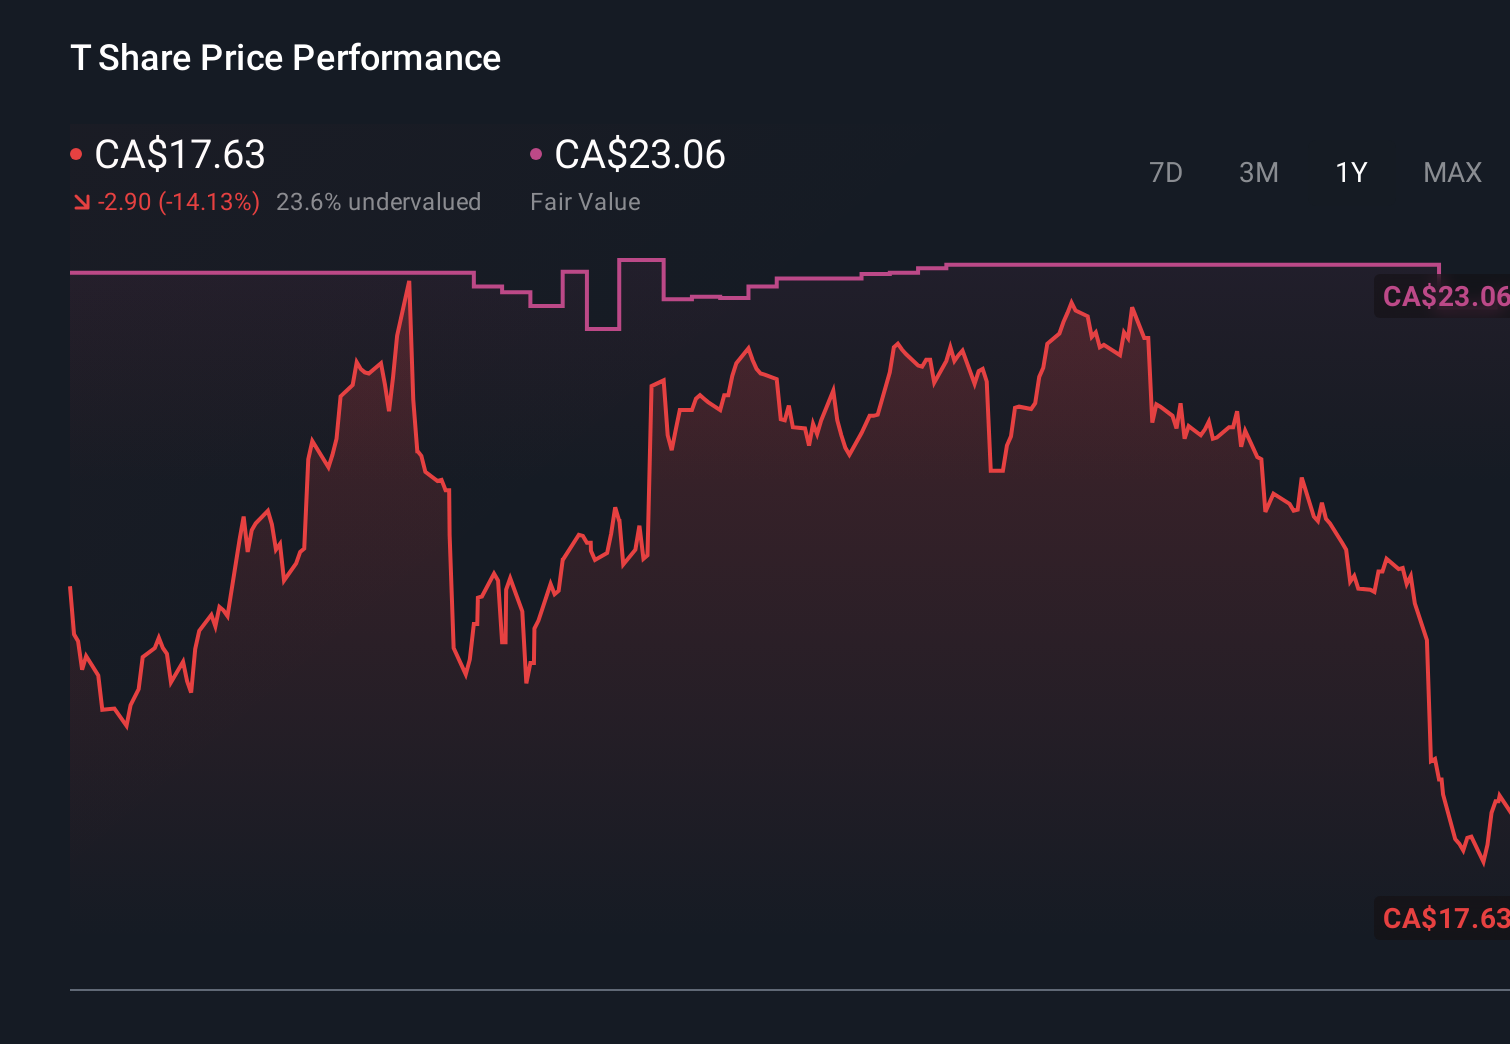
- Wondering if TELUS at around $17.63 is a bargain or a value trap? You are not alone, as this stock is firmly on many investors’ watchlists right now.
- Despite being a defensive telecom name, TELUS has slipped about 4.9% over the last week and 13.5% over the last month, leaving it down 10.2% year to date and 7.2% over the past year. These moves often catch value hunters’ attention.
- Much of this weakness has come as investors reassess interest rate expectations and capital-intensive sectors like telecoms, while TELUS continues to push ahead with its network investments and digital services strategy. At the same time, ongoing debates about competition and regulation in the Canadian wireless market have added another layer of uncertainty, contributing to the recent volatility.
- Right now TELUS scores a 3/6 valuation check, suggesting it screens as undervalued on half of our standard tests. We will walk through what that means across different valuation approaches before finishing with a more holistic way to think about what the stock is really worth.
Find out why TELUS's -7.2% return over the last year is lagging behind its peers.
Approach 1: TELUS Discounted Cash Flow (DCF) Analysis
A Discounted Cash Flow model estimates what a company is worth today by projecting the cash it can generate in the future and discounting those cash flows back to the present. For TELUS, this involves looking at expected Free Cash Flow and adjusting it for the time value of money and risk.
TELUS currently generates trailing twelve month Free Cash Flow of about CA$1.48 billion. Based on analyst estimates for the next few years, followed by Simply Wall St extrapolations beyond that, Free Cash Flow is projected to rise to roughly CA$4.47 billion by 2035. The 2 Stage Free Cash Flow to Equity model used here captures an initial phase of faster growth followed by a more mature period with slower growth.
After discounting all those projected cash flows back to today, the DCF model arrives at an intrinsic value of about CA$47.42 per share. Compared with the current share price around CA$17.63, this indicates TELUS may be trading at roughly a 62.8% discount, suggesting substantial upside potential if the projections prove accurate.
Result: UNDERVALUED
Our Discounted Cash Flow (DCF) analysis suggests TELUS is undervalued by 62.8%. Track this in your watchlist or portfolio, or discover 909 more undervalued stocks based on cash flows.

Approach 2: TELUS Price vs Earnings
For profitable, established companies like TELUS, the Price to Earnings ratio is a practical way to gauge value because it links what investors pay today to the profits the business is already generating. In general, companies with stronger, more reliable earnings growth and lower perceived risk can justify a higher PE multiple, while slower growing or riskier firms tend to trade on lower multiples.
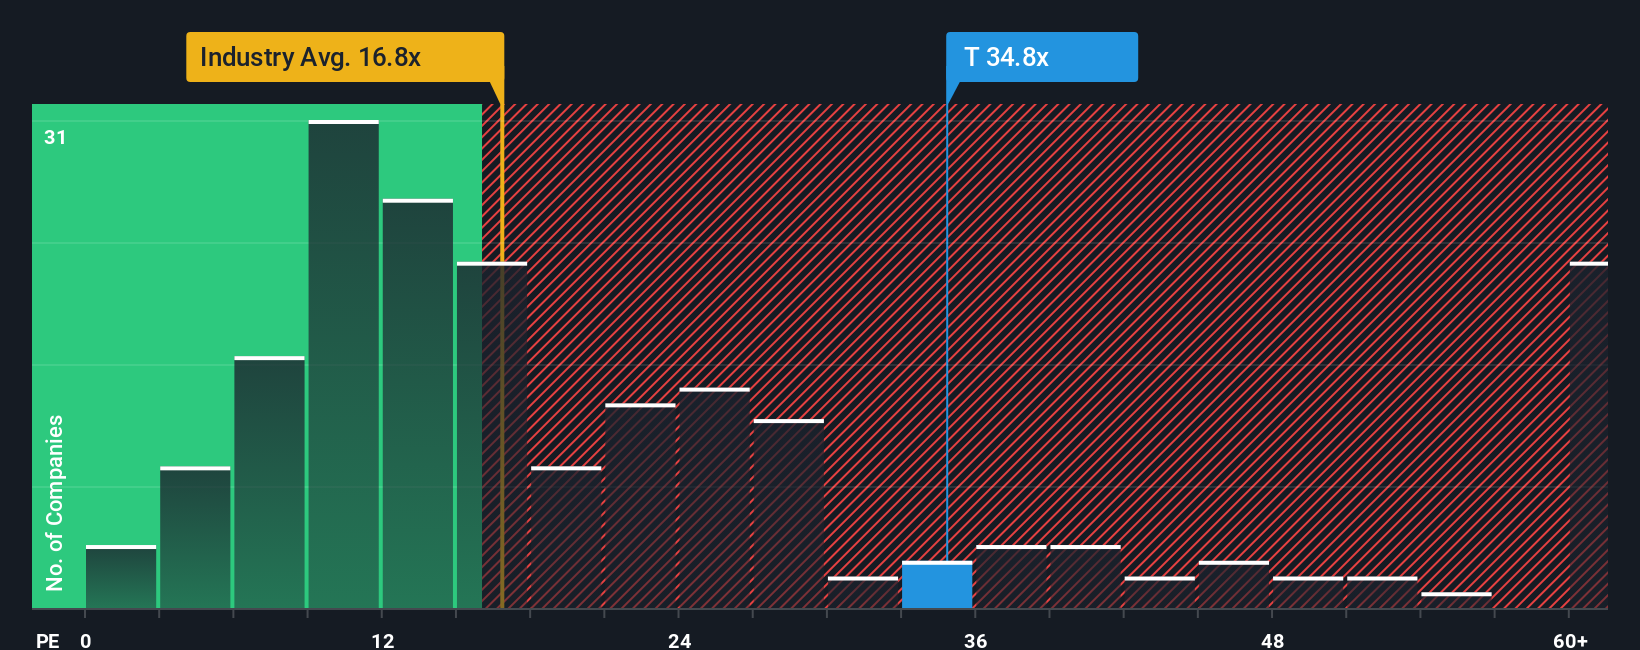
TELUS currently trades on a PE of about 23.1x, which is above both the broader Telecom industry average of roughly 16.2x and the peer average near 8.8x. Simply Wall St also calculates a proprietary Fair Ratio of around 12.5x for TELUS, which reflects what its PE might reasonably be given its earnings growth outlook, industry, profit margins, market cap and specific risk profile.
This Fair Ratio is more tailored than a simple comparison with peers or the industry, because it explicitly adjusts for TELUS specific characteristics rather than assuming all telecoms deserve similar valuations. With TELUS trading at 23.1x versus a Fair Ratio of 12.5x, the shares appear expensive on an earnings multiple basis, even after accounting for its fundamentals and risk factors.
Result: OVERVALUED
PE ratios tell one story, but what if the real opportunity lies elsewhere? Discover 1446 companies where insiders are betting big on explosive growth.
Upgrade Your Decision Making: Choose your TELUS Narrative
Earlier we mentioned that there is an even better way to understand valuation. Let us introduce you to Narratives, a simple tool on Simply Wall St’s Community page that lets you attach your own story about TELUS to the numbers. You can connect your view of its future revenue, earnings and margins to a financial forecast and a fair value estimate, then compare that Fair Value with the current share price to decide how you interpret the opportunity. Narratives update dynamically as new news or earnings are released, so different investors can express very different perspectives. For example, one TELUS Narrative might emphasize the long term potential of quantum safe networking, sovereign AI infrastructure and digital health to justify a fair value near the high end of analyst targets around CA$30.00. Another might focus on capital intensity, regulatory risks and slower revenue growth to support a more cautious fair value closer to the low end near CA$20.00. This gives you a clear, evolving picture of how your own thesis translates into numbers and a structured investment view.
Do you think there's more to the story for TELUS? Head over to our Community to see what others are saying!
This article by Simply Wall St is general in nature. We provide commentary based on historical data and analyst forecasts only using an unbiased methodology and our articles are not intended to be financial advice. It does not constitute a recommendation to buy or sell any stock, and does not take account of your objectives, or your financial situation. We aim to bring you long-term focused analysis driven by fundamental data. Note that our analysis may not factor in the latest price-sensitive company announcements or qualitative material. Simply Wall St has no position in any stocks mentioned.
Have feedback on this article? Concerned about the content? Get in touch with us directly. Alternatively, email editorial-team@simplywallst.com