
- PREMIUM
- LIVE QUOTES
- INSTITUTIONS
 Index Options
 State Street
 CME Group
 Nasdaq
 Cboe
Cboe TradingView
 Wall Street Journal
Guardant Health (GH) Valuation Check After New Trial Library Alliance in Precision Oncology
Guardant Health (GH) just deepened its footprint in oncology research with a new alliance, pairing its liquid biopsy data with Trial Library’s AI platform to make cancer trial access smoother and more equitable across the United States.
See our latest analysis for Guardant Health.
Those kinds of partnerships have landed at a moment when sentiment has already turned sharply, with Guardant’s 90 day share price return of 84.24 percent and year to date share price gain of 221.28 percent signaling strong, momentum driven expectations despite a still mixed longer term total shareholder return profile.
If Guardant’s story has you rethinking your healthcare exposure, this could be a smart time to explore other specialist names through healthcare stocks.
With shares surging and analysts steadily lifting price targets, investors now face a tougher question: does Guardant’s current valuation still leave meaningful upside on the table, or is the market already baking in the next leg of growth?
Most Popular Narrative: 1.2% Overvalued
With Guardant Health last closing at $102.07 against a narrative fair value of about $100.82, the prevailing story sees only a slight premium baked in, leaving investors focused squarely on execution through 2028.
Substantial regulatory, reimbursement, and clinical validation milestones (including Shield's breakthrough device status, NCCN guideline inclusion, and ongoing pilot studies) are paving the way for further guideline adoption, expanded payer coverage, and commercial inflections in Shield/MCED and Reveal volumes, significantly increasing future revenue and earnings visibility.
Want to know why this narrative leans into aggressive top line expansion, margin lift, and a future profit multiple rarely seen in healthcare diagnostics? Curious how assumptions about test uptake, payer behavior, and cash flow timing are stitched together to defend that high forward earnings multiple? The full narrative breaks down the roadmap in detail, but only if you are ready to see how bold the long range numbers really are.
Result: Fair Value of $100.82 (OVERVALUED)
Have a read of the narrative in full and understand what's behind the forecasts.
However, execution is far from guaranteed, with heavy cash burn and uncertain Shield reimbursement potentially derailing those 2028 earnings and valuation assumptions.
Find out about the key risks to this Guardant Health narrative.
Another View: Deep Value or Dangerous Mirage?
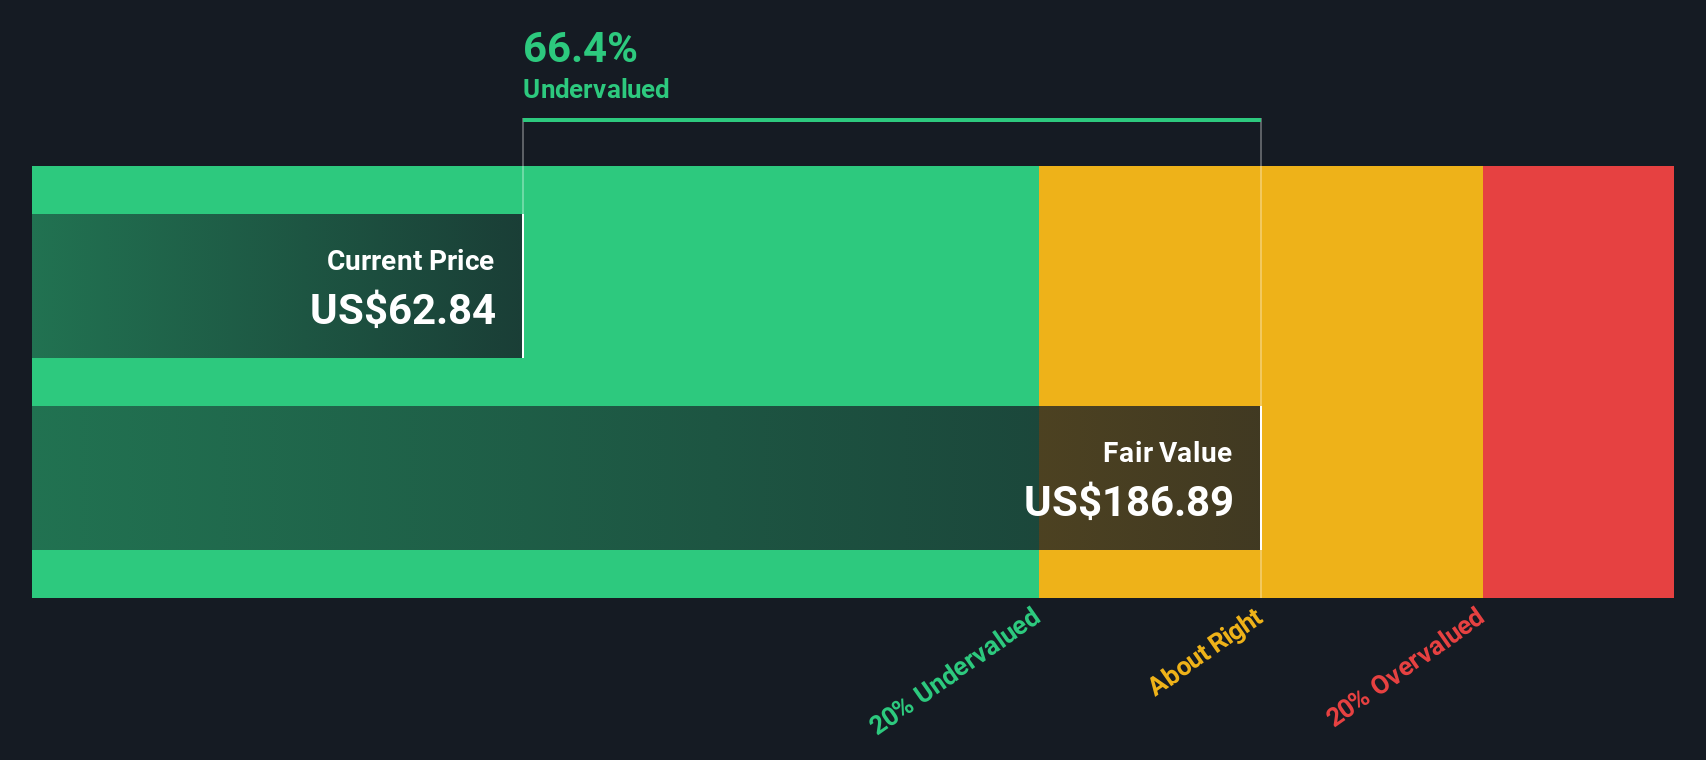
While the narrative fair value suggests Guardant Health is 1.2 percent overvalued at $102.07, our DCF model paints a very different picture, implying fair value closer to $241.61 and a roughly 58 percent discount. Is the market rightly skeptical, or underestimating how far this growth story can really run?
Look into how the SWS DCF model arrives at its fair value.
Simply Wall St performs a discounted cash flow (DCF) on every stock in the world every day (check out Guardant Health for example). We show the entire calculation in full. You can track the result in your watchlist or portfolio and be alerted when this changes, or use our stock screener to discover 901 undervalued stocks based on their cash flows. If you save a screener we even alert you when new companies match - so you never miss a potential opportunity.
Build Your Own Guardant Health Narrative
If this perspective does not quite fit your view, or you prefer digging into the numbers yourself, you can build a custom narrative in minutes: Do it your way
A great starting point for your Guardant Health research is our analysis highlighting 2 key rewards and 3 important warning signs that could impact your investment decision.
Looking for more investment ideas?
Before you move on, lock in your next opportunity by scanning targeted stock ideas on Simply Wall St’s Screener so your watchlist never falls behind.
- Capitalize on mispriced potential by reviewing these 901 undervalued stocks based on cash flows that pair attractive valuations with solid cash flow outlooks.
- Ride structural tech tailwinds by focusing on these 26 AI penny stocks positioned at the heart of breakthroughs in automation and data intelligence.
- Supercharge your income strategy by zeroing in on these 13 dividend stocks with yields > 3% that aim to deliver reliable cash returns alongside capital growth.
This article by Simply Wall St is general in nature. We provide commentary based on historical data and analyst forecasts only using an unbiased methodology and our articles are not intended to be financial advice. It does not constitute a recommendation to buy or sell any stock, and does not take account of your objectives, or your financial situation. We aim to bring you long-term focused analysis driven by fundamental data. Note that our analysis may not factor in the latest price-sensitive company announcements or qualitative material. Simply Wall St has no position in any stocks mentioned.
Have feedback on this article? Concerned about the content? Get in touch with us directly. Alternatively, email editorial-team@simplywallst.com