
- PREMIUM
- LIVE QUOTES
- INSTITUTIONS
 Index Options
 State Street
 CME Group
 Nasdaq
 Cboe
Cboe TradingView
 Wall Street Journal
Tsubakimoto Chain (TSE:6371) Valuation Check After New AI Logistics Alliance with Kioxia and EAGLYS
Tsubakimoto Chain (TSE:6371) just stepped further into AI driven logistics, teaming up with Kioxia and EAGLYS to showcase an image recognition system that targets rising automation needs and labor pressures.
See our latest analysis for Tsubakimoto Chain.
The collaboration lands against a solid backdrop, with a roughly 21 percent year to date share price return and a powerful five year total shareholder return of almost 200 percent. This suggests momentum is quietly building as logistics automation gains traction.
If this AI push has you thinking beyond a single name, it might be a good time to explore high growth tech and AI stocks for other automation and data driven opportunities.
Yet with earnings growth slowing and the share price already above analyst targets, the key question now is whether Tsubakimoto Chain is still mispriced or if the market has fully baked in its AI powered growth story.
Price to Earnings of 10.2x: Is it justified?
On a price to earnings basis, Tsubakimoto Chain looks modestly priced at its ¥2294 close, trading at levels that suggest some undervaluation versus peers.
The price to earnings ratio compares the company’s market value to its current earnings, which is a common yardstick for industrial and machinery names with steady profits.
At 10.2x earnings, the stock changes hands at a discount to the broader Japanese market on 14.2x and to the domestic Machinery industry on 12.7x. This hints that investors may not be fully crediting its profit track record. Relative to an estimated fair price to earnings ratio of 11.5x, there is also scope for the market multiple to drift higher if sentiment toward its earnings stabilises.
This discount stands out even more against the peer average multiple of 16.5x. This underscores how conservatively the market is valuing each yen of Tsubakimoto Chain’s earnings compared to similar companies.
Explore the SWS fair ratio for Tsubakimoto Chain
Result: Price-to-Earnings of 10.2x (UNDERVALUED)
However, slowing net income growth and a share price already above analyst targets could quickly temper enthusiasm if AI driven orders or margins disappoint.
Find out about the key risks to this Tsubakimoto Chain narrative.
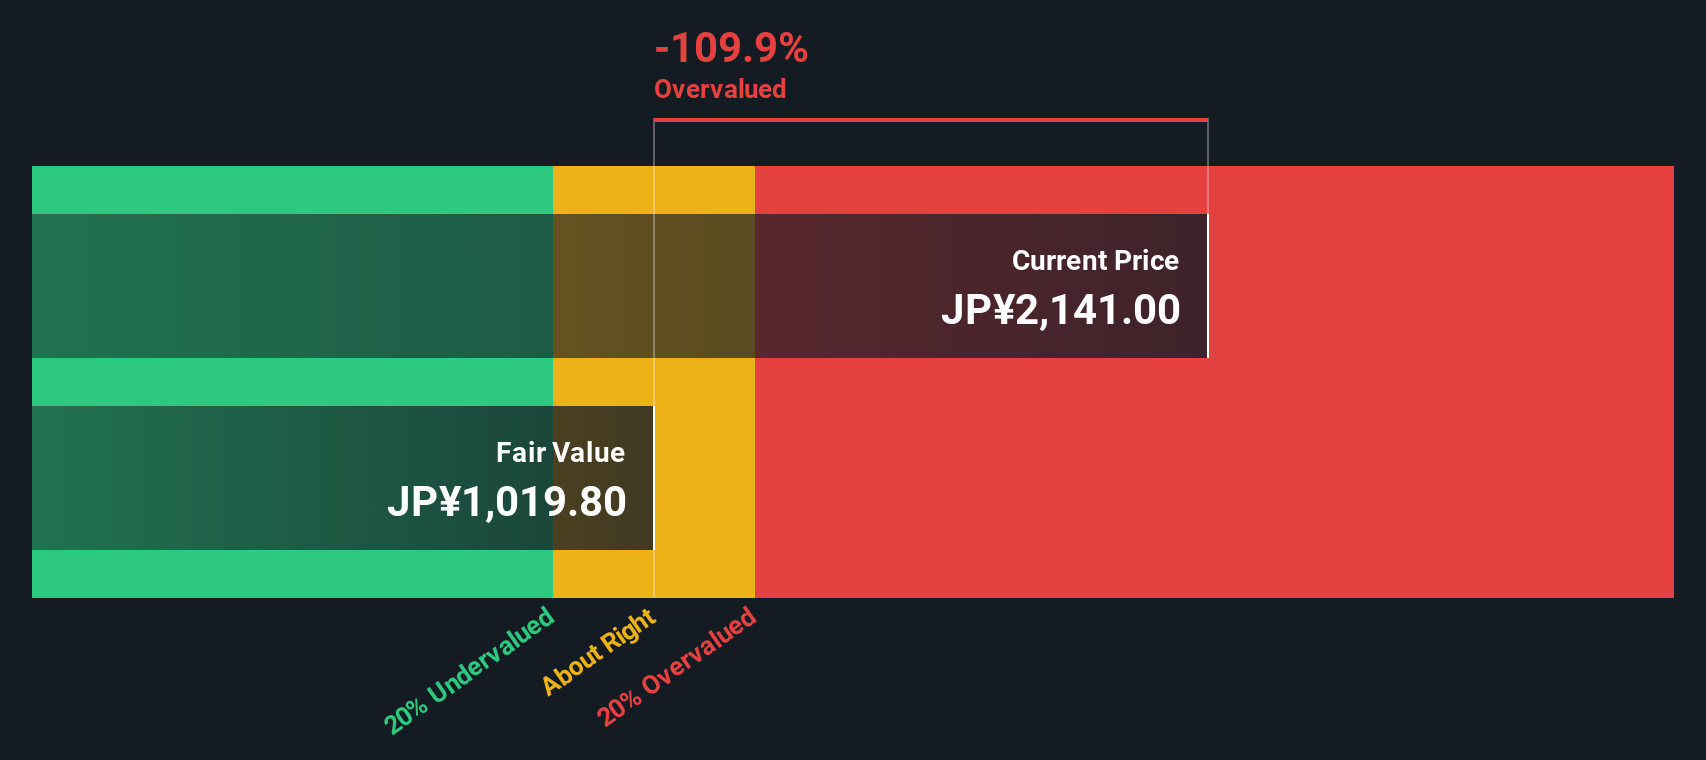
Another View: Our DCF Model Paints a Tougher Picture
While earnings multiples point to good relative value, our DCF model tells a very different story. On that basis, Tsubakimoto Chain’s fair value sits near ¥1027.53, well below the current ¥2294 share price. This indicates the stock screens as materially overvalued. Which signal should investors trust more: sentiment today or cash flows tomorrow?
Look into how the SWS DCF model arrives at its fair value.
Simply Wall St performs a discounted cash flow (DCF) on every stock in the world every day (check out Tsubakimoto Chain for example). We show the entire calculation in full. You can track the result in your watchlist or portfolio and be alerted when this changes, or use our stock screener to discover 904 undervalued stocks based on their cash flows. If you save a screener we even alert you when new companies match - so you never miss a potential opportunity.
Build Your Own Tsubakimoto Chain Narrative
If you see the numbers differently or want to run your own checks from scratch, you can build a fresh narrative in minutes: Do it your way.
A great starting point for your Tsubakimoto Chain research is our analysis highlighting 4 key rewards and 2 important warning signs that could impact your investment decision.
Looking for more investment ideas?
Before you move on, consider using the Simply Wall St Screener to uncover fresh, data backed opportunities you might otherwise miss.
- Target dependable income streams by scanning these 13 dividend stocks with yields > 3% that could support your portfolio’s cash flow.
- Explore structural trends by focusing on these 26 AI penny stocks involved in intelligent automation.
- Look for valuation gaps by reviewing these 904 undervalued stocks based on cash flows that the market may be mispricing.
This article by Simply Wall St is general in nature. We provide commentary based on historical data and analyst forecasts only using an unbiased methodology and our articles are not intended to be financial advice. It does not constitute a recommendation to buy or sell any stock, and does not take account of your objectives, or your financial situation. We aim to bring you long-term focused analysis driven by fundamental data. Note that our analysis may not factor in the latest price-sensitive company announcements or qualitative material. Simply Wall St has no position in any stocks mentioned.
Have feedback on this article? Concerned about the content? Get in touch with us directly. Alternatively, email editorial-team@simplywallst.com