
- PREMIUM
- LIVE QUOTES
- INSTITUTIONS
 Index Options
 State Street
 CME Group
 Nasdaq
 Cboe
Cboe TradingView
 Wall Street Journal
Is ScotiaBank’s Strong 2025 Rally Still Justified After Strategic Refocus and Valuation Checks?
- If you are wondering whether Bank of Nova Scotia is still a smart buy after such a strong run, or if the upside has mostly played out, you are not alone. We are going to unpack exactly what the current price might be implying.
- The stock has climbed 0.9% over the last week and 5.8% over the past month, and is now up 29.7% year to date. Longer term gains of 34.3% over 1 year, 84.6% over 3 years, and 95.7% over 5 years are reshaping how investors see its risk and reward profile.
- Recent headlines have focused on Bank of Nova Scotia sharpening its strategic focus in core markets and reshuffling parts of its leadership team, moves that investors often read as a signal of renewed execution discipline. At the same time, ongoing discussions about capital requirements and economic resilience for Canadian banks have kept the whole sector, including BNS, firmly in the spotlight.
- Despite all that momentum, Bank of Nova Scotia only scores a 2/6 valuation score, suggesting it screens as undervalued on just a couple of our usual checks. This is why we will walk through different valuation approaches next and finish with an additional way to think about what the market might really be pricing in.
Bank of Nova Scotia scores just 2/6 on our valuation checks. See what other red flags we found in the full valuation breakdown.
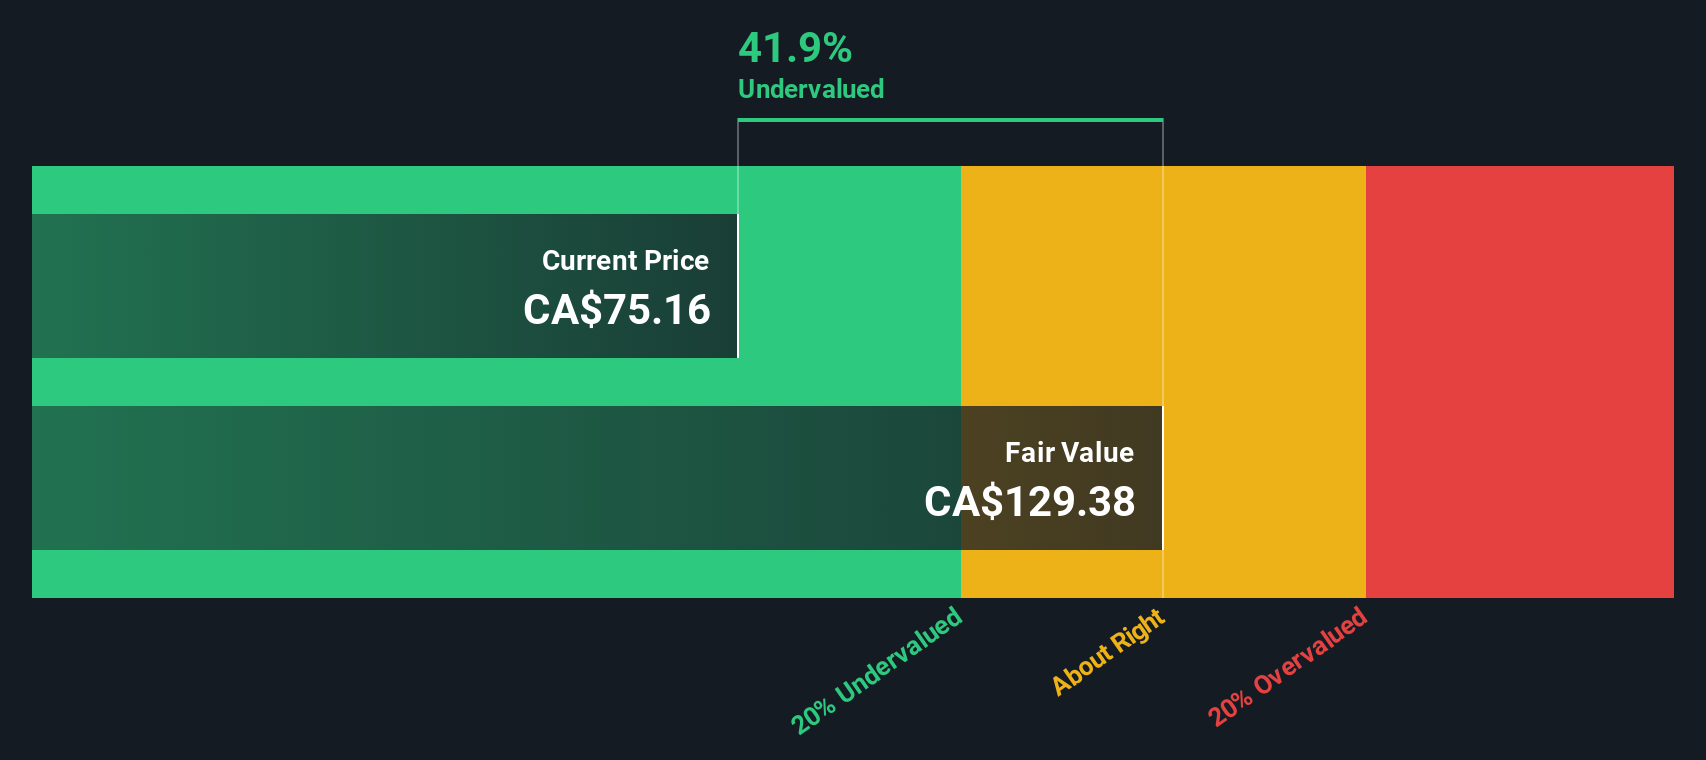
Approach 1: Bank of Nova Scotia Excess Returns Analysis
The Excess Returns model looks at how much value a bank creates over and above the basic return that equity investors require, and then capitalizes those extra profits into an intrinsic value per share.
For Bank of Nova Scotia, the model starts with a Book Value of CA$70.26 per share and a Stable EPS of CA$8.86 per share. These figures are based on weighted future Return on Equity estimates from 8 analysts. With an Average Return on Equity of 13.14% and a Cost of Equity of CA$4.88 per share, the bank is expected to generate Excess Returns of CA$3.97 per share. In other words, the bank is forecast to earn meaningfully more on its equity base than the return investors demand.
Using a Stable Book Value of CA$67.40 per share, informed by estimates from 10 analysts, these excess profits are projected forward and converted into an intrinsic value of roughly CA$155.75 per share. Compared with the current market price, this implies the shares are about 35.7% undervalued.
Result: UNDERVALUED
Our Excess Returns analysis suggests Bank of Nova Scotia is undervalued by 35.7%. Track this in your watchlist or portfolio, or discover 908 more undervalued stocks based on cash flows.
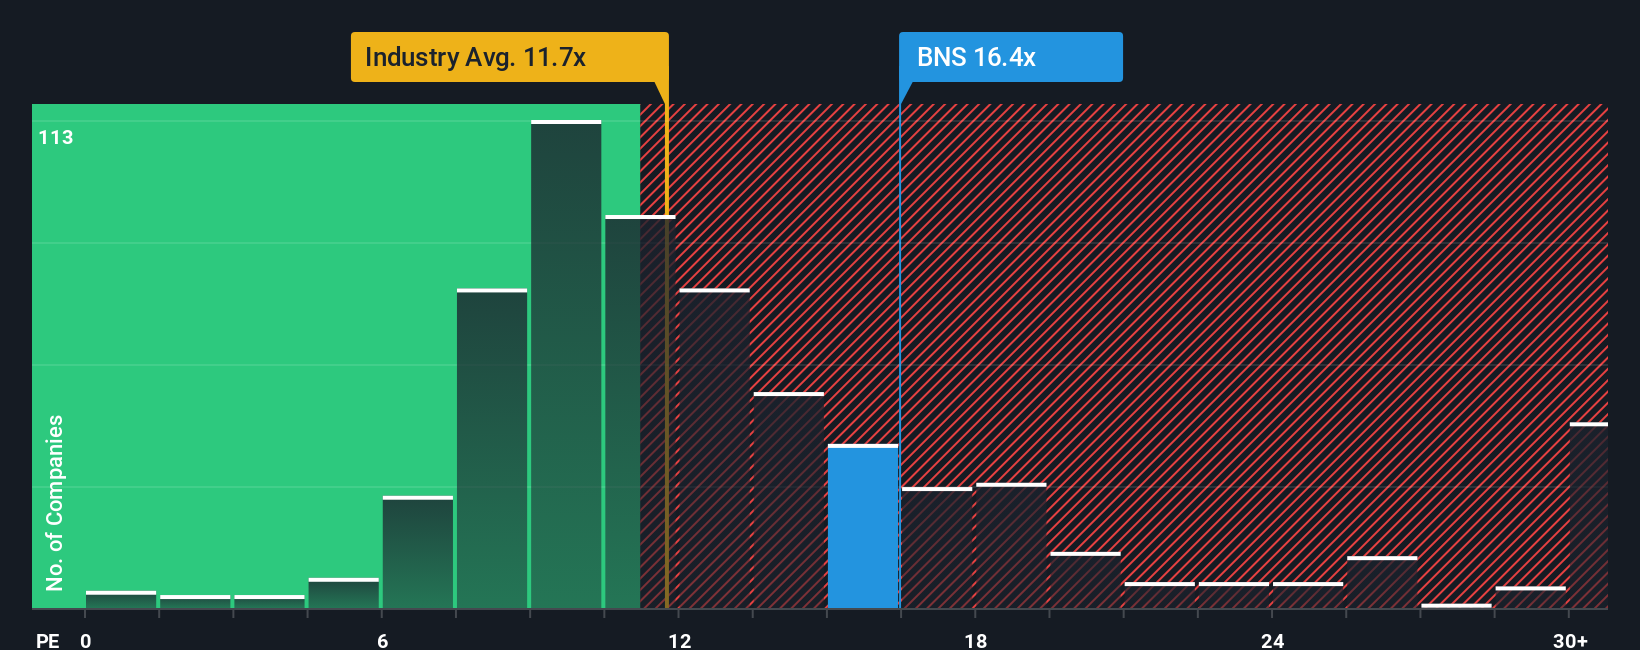
Approach 2: Bank of Nova Scotia Price vs Earnings
For a mature, consistently profitable bank like Bank of Nova Scotia, the Price to Earnings (PE) ratio is a practical way to gauge valuation, because it directly links what investors pay today to the profits the bank is generating. In general, companies with stronger growth prospects or lower perceived risk can justify a higher PE, while slower growth or higher risk tends to push a fair PE lower.
Bank of Nova Scotia currently trades on a PE of 17.1x, which sits above both the broader Banks industry average of 10.8x and the peer group average of 14.6x. At first glance, that could suggest the market is already paying up for its earnings. However, Simply Wall St’s proprietary Fair Ratio for Bank of Nova Scotia is 15.5x, which estimates what a reasonable PE should be after accounting for its specific earnings growth outlook, profitability, risk profile, industry positioning and market cap.
This Fair Ratio is more informative than a simple industry or peer comparison, because it adjusts for the bank’s own fundamentals rather than assuming all banks deserve the same multiple. With the current PE of 17.1x sitting moderately above the 15.5x Fair Ratio, the shares appear slightly expensive on this metric.
Result: OVERVALUED
PE ratios tell one story, but what if the real opportunity lies elsewhere? Discover 1445 companies where insiders are betting big on explosive growth.
Upgrade Your Decision Making: Choose your Bank of Nova Scotia Narrative
Earlier we mentioned that there is an even better way to understand valuation, so let us introduce you to Narratives, an easy tool on Simply Wall St’s Community page that lets you connect your own story about Bank of Nova Scotia to concrete assumptions about its future revenue, earnings, margins and fair value. This allows you to see whether your estimated Fair Value is above or below today’s share price and decide if you want to buy, hold or sell, with the platform dynamically updating that Narrative as new earnings or news arrive. For example, one investor might build a bullish Narrative around rising returns on equity, faster digital adoption, and a fair value closer to the high end of analyst targets near CA$99. Another might focus on Latin American risk, housing exposure and regulation, and conclude that a more cautious fair value nearer the low end around CA$78 is appropriate. This shows how different but clearly defined perspectives can guide more confident decisions.
Do you think there's more to the story for Bank of Nova Scotia? Head over to our Community to see what others are saying!

This article by Simply Wall St is general in nature. We provide commentary based on historical data and analyst forecasts only using an unbiased methodology and our articles are not intended to be financial advice. It does not constitute a recommendation to buy or sell any stock, and does not take account of your objectives, or your financial situation. We aim to bring you long-term focused analysis driven by fundamental data. Note that our analysis may not factor in the latest price-sensitive company announcements or qualitative material. Simply Wall St has no position in any stocks mentioned.
Have feedback on this article? Concerned about the content? Get in touch with us directly. Alternatively, email editorial-team@simplywallst.com