
- PREMIUM
- LIVE QUOTES
- INSTITUTIONS
 Index Options
 State Street
 CME Group
 Nasdaq
 Cboe
Cboe TradingView
 Wall Street Journal
Is It Too Late To Consider Xcel Energy After Its Strong 2025 Share Price Rally?
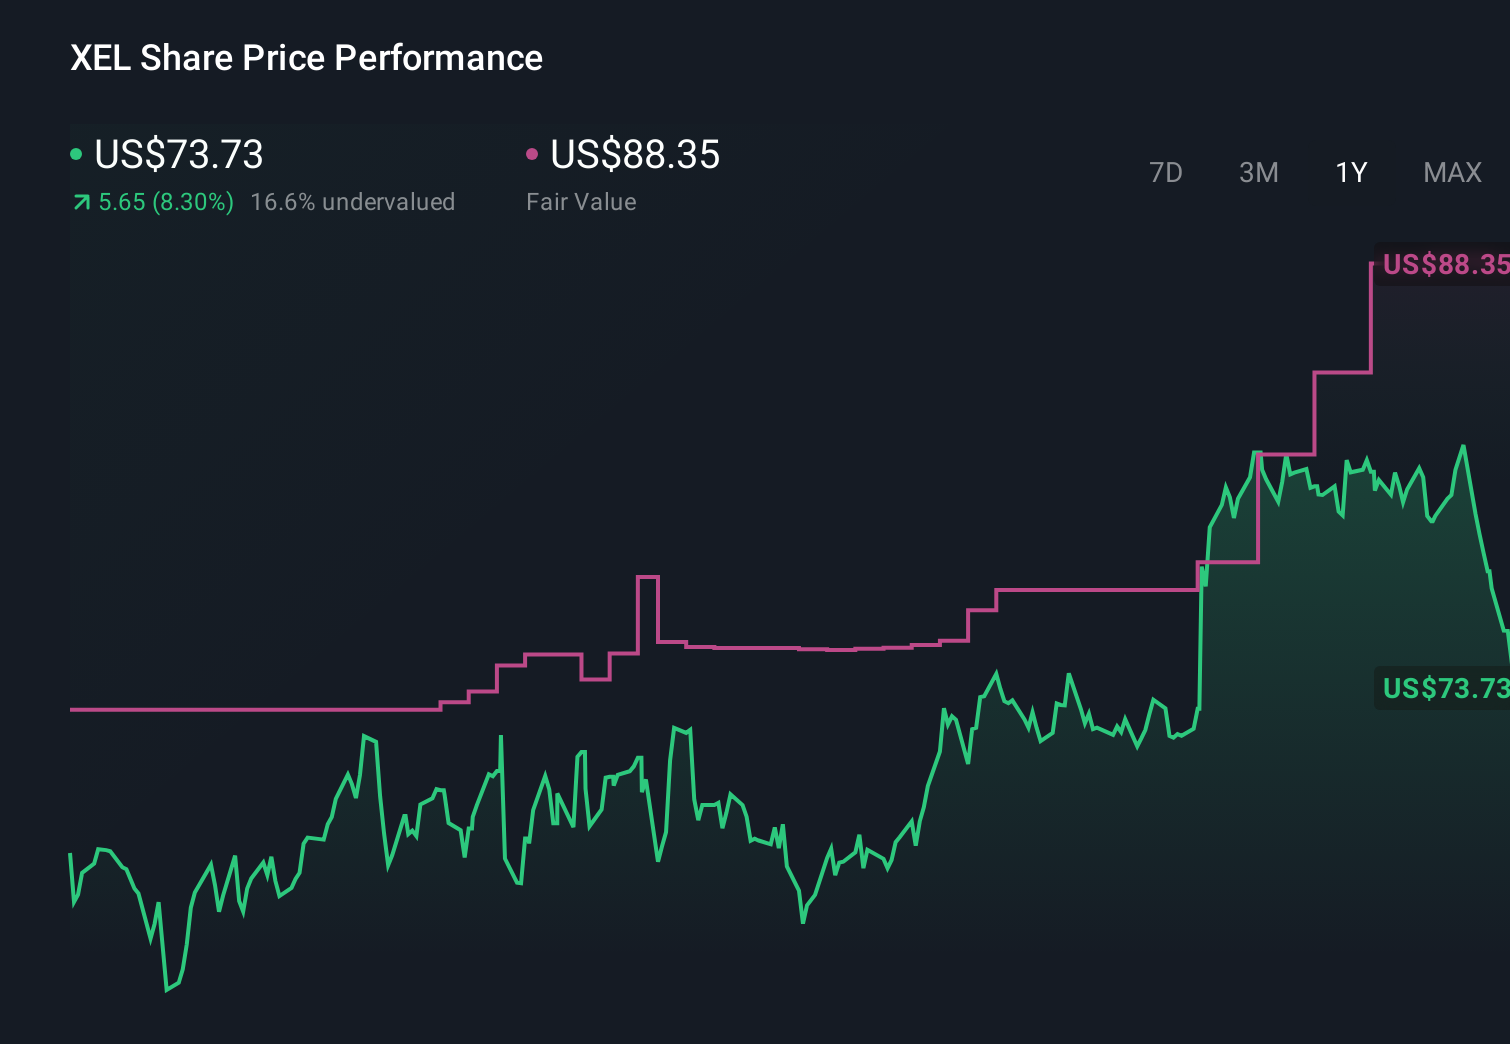
- If you are wondering whether Xcel Energy at around $75 is still worth considering or if the value has already been priced in, you are in the right place.
- Despite being up 12.4% year to date and 14.0% over the last year, the stock has recently cooled off with a 2.6% dip in the past week and a 6.7% slide over the last month, which can open up more interesting entry points.
- Recent headlines around the energy transition, grid reliability and regulated utilities' role in supporting growing data center and AI power demand have pushed investors to rethink how much growth a utility like Xcel can deliver. Policy developments around clean energy incentives and infrastructure investment are also shaping expectations for the company, and that helps explain some of the recent share price volatility.
- Right now, Xcel Energy scores just 1 out of 6 on our valuation checks. On the surface this suggests it does not look like a clear bargain. However, different valuation approaches can tell very different stories, and we will walk through those next before finishing with a more holistic way to think about Xcel's value.
Xcel Energy scores just 1/6 on our valuation checks. See what other red flags we found in the full valuation breakdown.
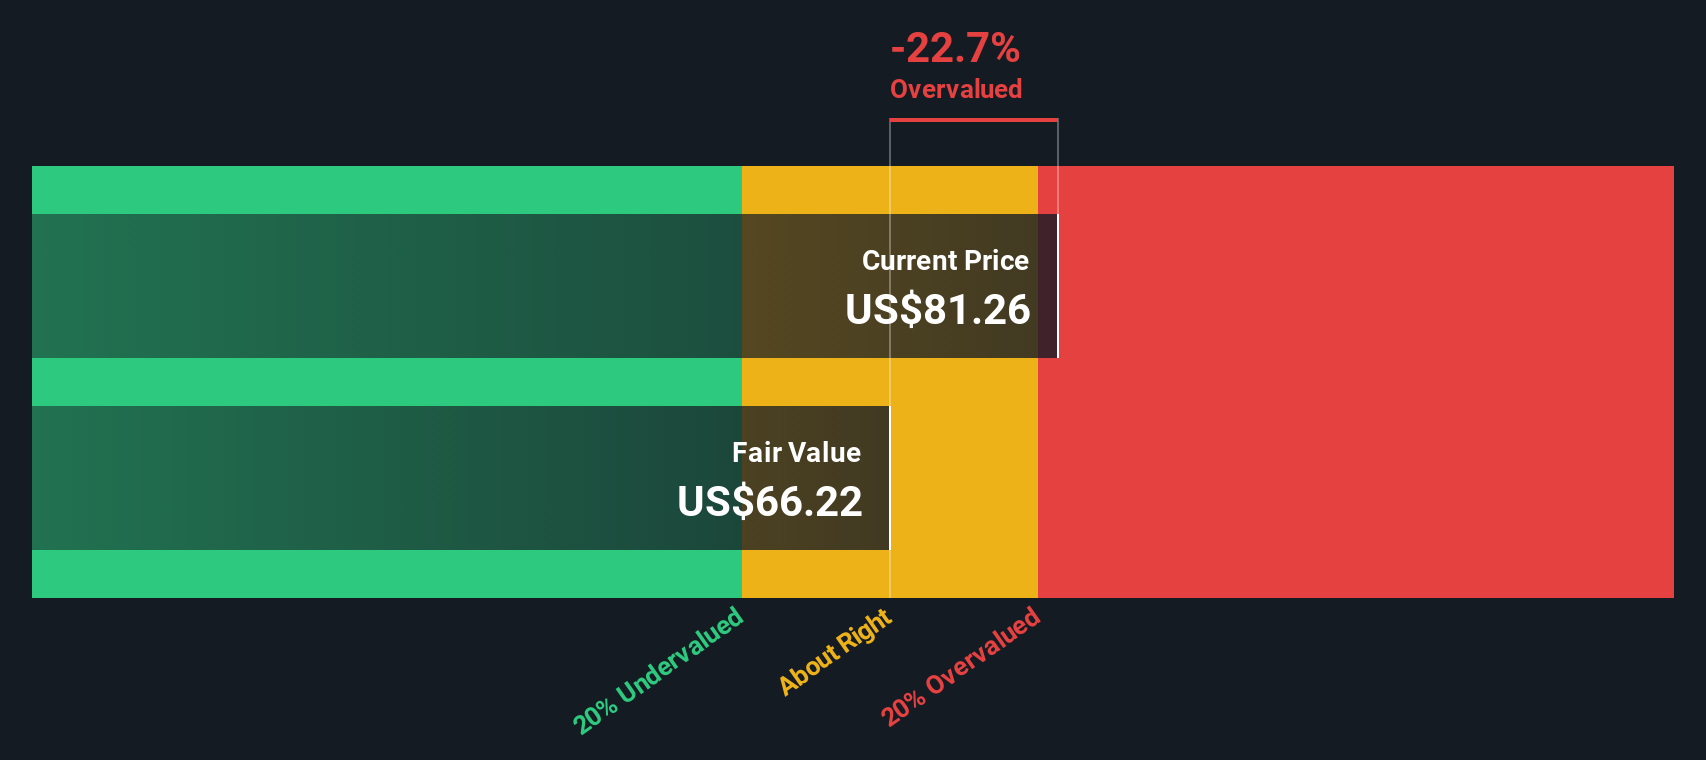
Approach 1: Xcel Energy Dividend Discount Model (DDM) Analysis
The Dividend Discount Model estimates what Xcel Energy shares are worth by projecting future dividend payments and discounting them back to today, asking whether the current price is justified by those expected cash returns to shareholders.
For Xcel, the model starts with an annual dividend per share of about $2.43 and assumes the company can grow that dividend at roughly 3.3% a year, capped from a higher underlying growth estimate of about 4.1%. This is anchored in an estimated return on equity of 10.5% and a payout ratio close to 61%, suggesting the company is returning a solid share of profits to investors while still retaining enough to fund growth.
On these assumptions, the DDM arrives at an intrinsic value of around $65.71 a share. Compared with the current price near $75, that implies Xcel Energy is roughly 14.4% overvalued, meaning investors are paying a premium for its dividend stability and growth profile.
Result: OVERVALUED
Our Dividend Discount Model (DDM) analysis suggests Xcel Energy may be overvalued by 14.4%. Discover 908 undervalued stocks or create your own screener to find better value opportunities.
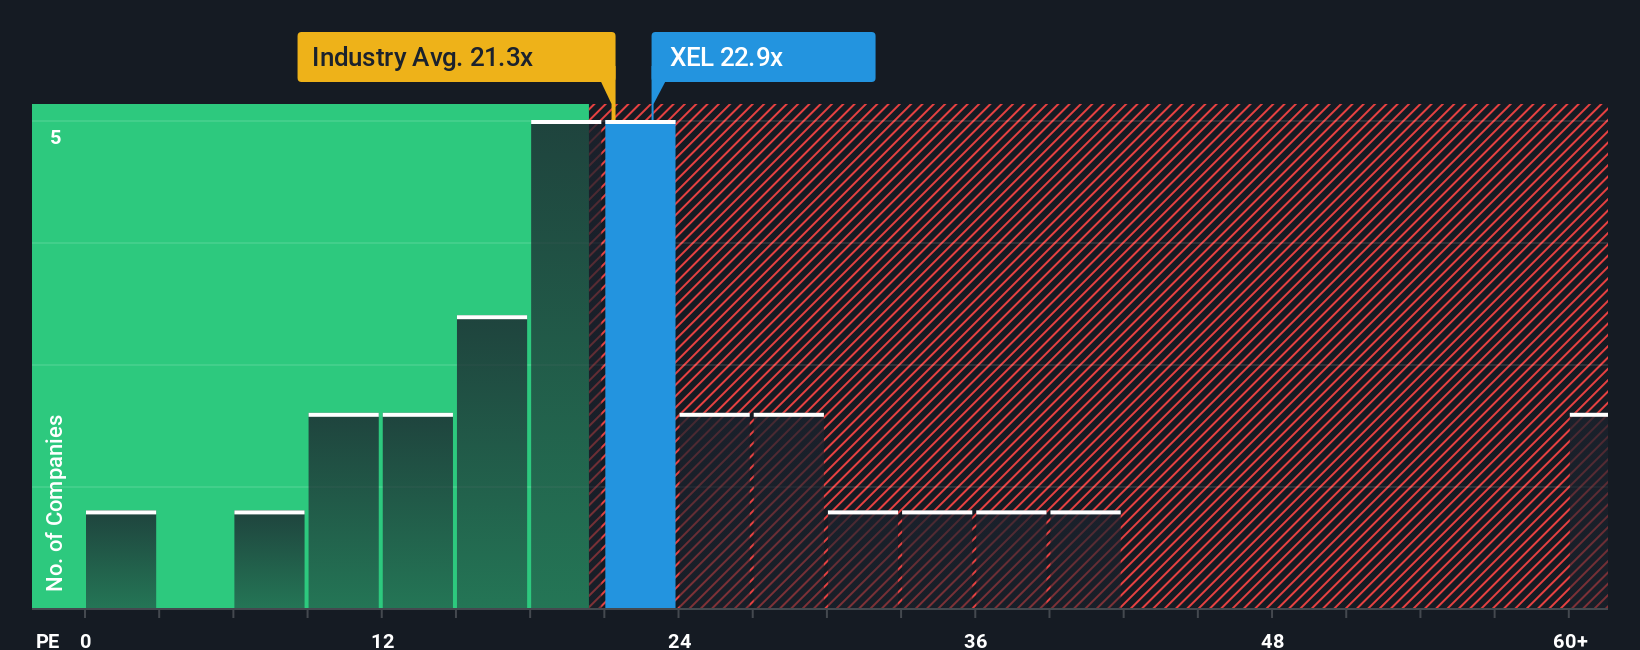
Approach 2: Xcel Energy Price vs Earnings
For a mature, profitable utility like Xcel, the price to earnings (PE) ratio is a practical way to gauge whether investors are paying a reasonable price for each dollar of current earnings. Because earnings tend to be relatively stable for regulated utilities, PE gives a cleaner snapshot of value than revenue or asset based metrics alone.
What counts as a “normal” PE depends on how fast earnings are expected to grow and how risky those earnings are. Higher growth and lower perceived risk can justify a higher multiple, while slower or less certain growth should trade at a discount. Xcel currently trades on a PE of about 23.2x, above both the Electric Utilities industry average of roughly 20.0x and the peer average of around 19.5x, suggesting investors are already paying a premium to the sector.
Simply Wall St’s Fair Ratio refines this further by estimating what PE Xcel should trade on, given its earnings growth outlook, risk profile, margins, industry and market cap. For Xcel, that Fair Ratio is 25.5x, which is higher than today’s 23.2x. On this basis, the shares look modestly undervalued relative to what its fundamentals and risk profile would normally warrant.
Result: UNDERVALUED
PE ratios tell one story, but what if the real opportunity lies elsewhere? Discover 1445 companies where insiders are betting big on explosive growth.
Upgrade Your Decision Making: Choose your Xcel Energy Narrative
Earlier we mentioned that there is an even better way to understand valuation, so let us introduce you to Narratives, which are simple stories that investors build around a company, linking their view of its future revenue, earnings and margins to a financial forecast and then to a fair value estimate. On Simply Wall St’s Community page, used by millions of investors, Narratives turn raw numbers into an easy, accessible tool by letting you say, in effect, “here is the Xcel Energy I believe in, here is what its cash flows could look like, and here is what I think the shares are worth,” and then comparing that Fair Value with the current Price to decide whether it is a buy, hold or sell. Because Narratives update dynamically as new earnings, news or regulatory developments arrive, your view of Xcel does not stay static. One investor might build a bullish Narrative that sees fair value in the high $80s based on strong grid investment and clean energy growth. Another might create a more cautious Narrative closer to the low $60s if they are focused on wildfire liabilities and execution risks.
Do you think there's more to the story for Xcel Energy? Head over to our Community to see what others are saying!
This article by Simply Wall St is general in nature. We provide commentary based on historical data and analyst forecasts only using an unbiased methodology and our articles are not intended to be financial advice. It does not constitute a recommendation to buy or sell any stock, and does not take account of your objectives, or your financial situation. We aim to bring you long-term focused analysis driven by fundamental data. Note that our analysis may not factor in the latest price-sensitive company announcements or qualitative material. Simply Wall St has no position in any stocks mentioned.
Have feedback on this article? Concerned about the content? Get in touch with us directly. Alternatively, email editorial-team@simplywallst.com