
- PREMIUM
- LIVE QUOTES
- INSTITUTIONS
 Index Options
 State Street
 CME Group
 Nasdaq
 Cboe
Cboe TradingView
 Wall Street Journal
Is Voyager Technologies Stock Price Justified After Recent 33.5% Surge?
- If you are wondering whether Voyager Technologies at around $26 a share is a bargain or a value trap, you are not alone. This breakdown is designed to give you a clear, no nonsense view of what the numbers actually say.
- The stock has bounced sharply in the short term, up 11.7% over the last week and 33.5% over the past month, even though it remains down around 53.0% year to date. That pattern suggests sentiment and perceived risk are shifting quickly.
- That swing has come as investors refocus on the company’s positioning in capital goods and its potential role in enabling next generation infrastructure, while also weighing ongoing competitive and regulatory uncertainty. Together, those themes have added volatility as the market tries to decide whether Voyager’s story is turning a corner or simply pausing within a longer downtrend.
- On our basic valuation checklist, Voyager scores just 0/6 for being undervalued. In the sections that follow we will start with traditional valuation methods, and then wrap up with a more holistic way to think about what this price might really mean.
Voyager Technologies scores just 0/6 on our valuation checks. See what other red flags we found in the full valuation breakdown.
Approach 1: Voyager Technologies Discounted Cash Flow (DCF) Analysis
A Discounted Cash Flow model estimates what a business is worth today by projecting its future cash flows and then discounting those back into current dollars. For Voyager Technologies, the model used is a 2 Stage Free Cash Flow to Equity approach, focused on cash available to shareholders in $.
Right now, Voyager is burning cash, with last twelve month free cash flow of about $51.46 Million outflow. Analyst forecasts, combined with Simply Wall St extrapolations, point to steeply negative free cash flow through 2027, followed by a shift to positive territory and then a moderation in growth. By 2035, projected free cash flow is only around $90.28 Million, reflecting a business that may grow but not explosively.
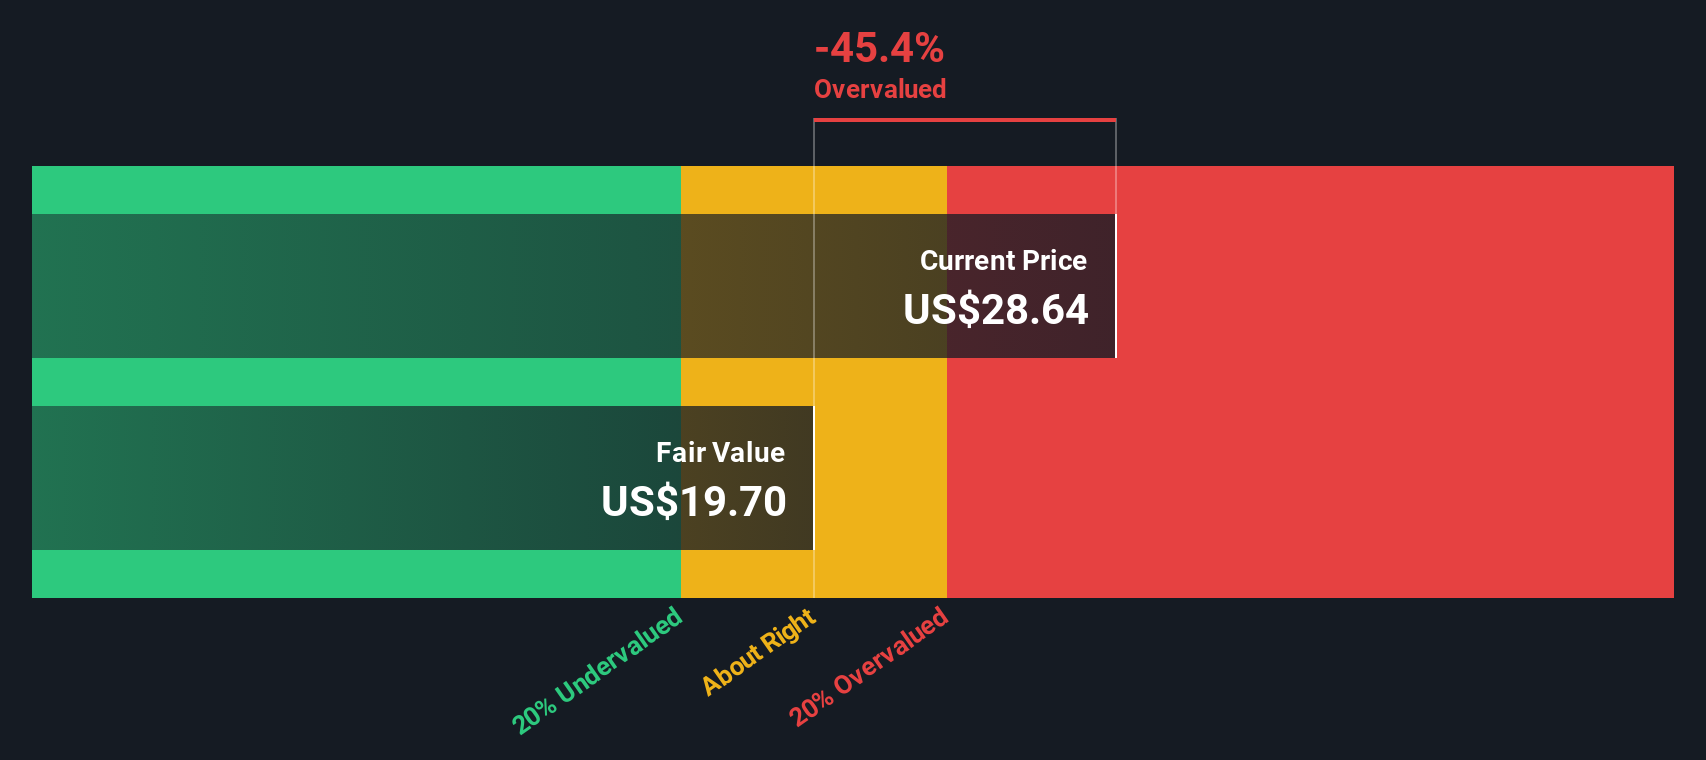
When all those projected cash flows are discounted back, the intrinsic value comes out at roughly $16.73 per share, while the stock trades near $26. That implies it is about 58.6% overvalued based on this DCF view, suggesting investors are paying well ahead of the underlying cash flow story.
Result: OVERVALUED
Our Discounted Cash Flow (DCF) analysis suggests Voyager Technologies may be overvalued by 58.6%. Discover 908 undervalued stocks or create your own screener to find better value opportunities.
Approach 2: Voyager Technologies Price vs Sales
For younger or less profitable businesses like Voyager Technologies, the price to sales ratio is often a better yardstick than earnings based multiples, because revenue is typically more stable and less distorted by investment spending or accounting swings. Investors usually accept a higher price to sales multiple when they expect strong, durable growth and see lower risk in the business model, while slower or riskier companies tend to command lower, more conservative multiples.
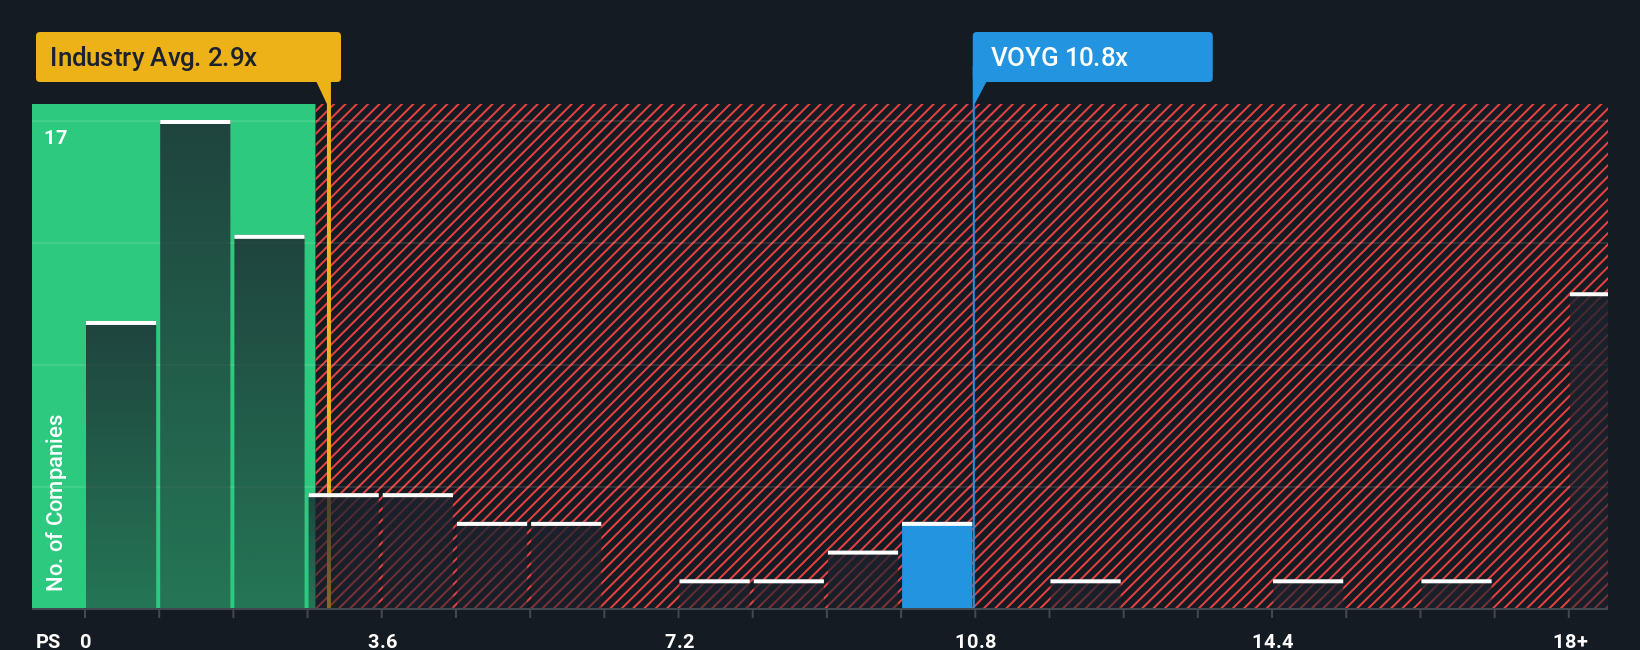
Voyager currently trades at about 10.0x sales, a hefty premium to the Aerospace and Defense industry average of roughly 3.1x and the peer average of around 1.8x. To get beyond simple comparisons, Simply Wall St estimates a Fair Ratio of about 3.8x sales for Voyager, based on its specific mix of growth prospects, margins, risk profile, size and industry positioning. This Fair Ratio is more informative than a blunt peer or industry check because it adjusts for Voyager’s own fundamentals rather than assuming it should look like an average competitor.
Stacking the current 10.0x against the 3.8x Fair Ratio suggests the market is pricing in a lot of optimism and then some.
Result: OVERVALUED
PS ratios tell one story, but what if the real opportunity lies elsewhere? Discover 1444 companies where insiders are betting big on explosive growth.
Upgrade Your Decision Making: Choose your Voyager Technologies Narrative
Earlier we mentioned that there is an even better way to understand valuation, so let us introduce you to Narratives, a simple way to connect your view of a company’s story with a concrete financial forecast and a fair value estimate. A Narrative is your explanation of what you think will happen to a business, translated into assumptions about future revenue, earnings and margins that sit behind a clear fair value number. On Simply Wall St’s Community page, used by millions of investors, you can easily create or explore Narratives for Voyager Technologies. You can then see how each story maps to a specific fair value and how that compares to today’s share price to inform your own decisions. These Narratives update dynamically as fresh information such as earnings releases or major news emerges. This helps your view stay current without you rebuilding the whole model. For Voyager, one investor might see modest growth and a lower fair value than today’s price, while another might expect rapid adoption of its infrastructure technologies and arrive at a much higher fair value.
Do you think there's more to the story for Voyager Technologies? Head over to our Community to see what others are saying!

This article by Simply Wall St is general in nature. We provide commentary based on historical data and analyst forecasts only using an unbiased methodology and our articles are not intended to be financial advice. It does not constitute a recommendation to buy or sell any stock, and does not take account of your objectives, or your financial situation. We aim to bring you long-term focused analysis driven by fundamental data. Note that our analysis may not factor in the latest price-sensitive company announcements or qualitative material. Simply Wall St has no position in any stocks mentioned.
Have feedback on this article? Concerned about the content? Get in touch with us directly. Alternatively, email editorial-team@simplywallst.com