
- PREMIUM
- LIVE QUOTES
- INSTITUTIONS
 Index Options
 State Street
 CME Group
 Nasdaq
 Cboe
Cboe TradingView
 Wall Street Journal
Can DENTSPLY SIRONA’s Turnaround Efforts Justify a Rebound After a 38% Slide?
- If you have been wondering whether DENTSPLY SIRONA is a bargain or a value trap at around $11.57, you are not alone. This is exactly the kind of stock where a closer valuation check can really change your view.
- The share price has bounced 2.8% over the last week and 10.0% over the past month, yet it is still down a steep 38.3% year to date and 38.8% over the last year, after much heavier 3-year and 5-year declines.
- Recent headlines have focused on DENTSPLY SIRONA's strategic reshaping of its product portfolio and ongoing efforts to streamline operations. This helps explain some of the shifting sentiment in the stock. At the same time, investors have been debating whether these moves can reignite growth in a dental equipment market that is becoming more competitive and innovation driven.
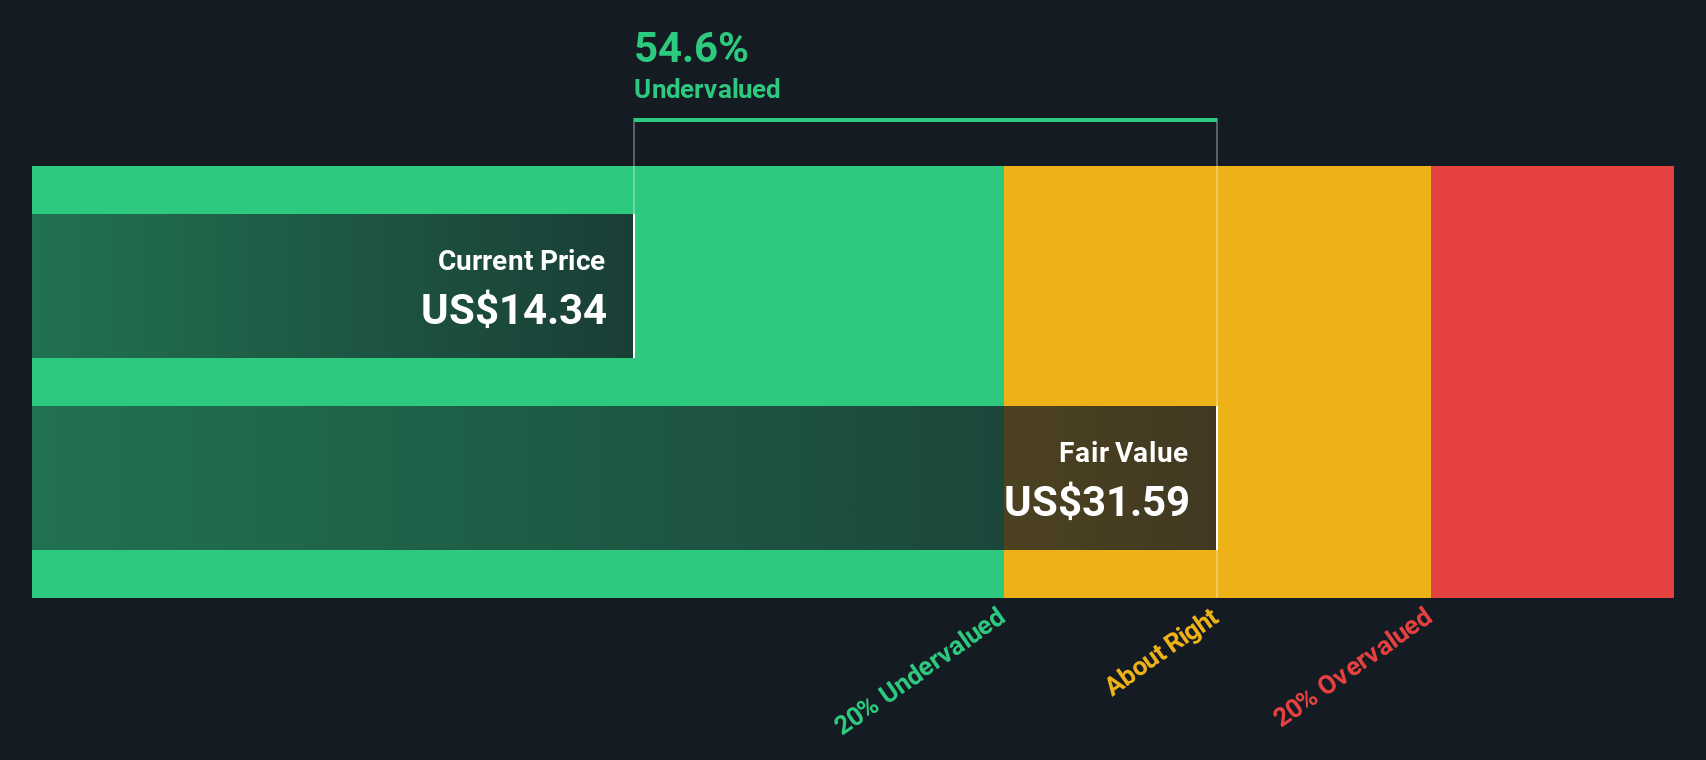
- On our framework the company scores a 5/6 valuation check, suggesting it screens as undervalued on most metrics. Next we will unpack how different valuation approaches arrive at that view and why there may be an even better way to think about its true worth by the end of this article.
Find out why DENTSPLY SIRONA's -38.8% return over the last year is lagging behind its peers.
Approach 1: DENTSPLY SIRONA Discounted Cash Flow (DCF) Analysis
A Discounted Cash Flow model estimates what a company is worth by projecting the cash it can generate in the future and discounting those cash flows back to today in $ terms.
For DENTSPLY SIRONA, the latest twelve month free cash flow is about $78.4 Million, and analysts expect this to rise significantly as the business reshapes its portfolio and improves efficiency. Under the 2 Stage Free Cash Flow to Equity model, analyst forecasts are used for the next few years, and then Simply Wall St extrapolates further, with projected free cash flow reaching roughly $407 Million by 2029 and continuing to grow beyond that.
When these future cash flows are discounted back to today, the intrinsic value is estimated at about $29.95 per share. Compared with a current share price around $11.57, the DCF output implies the stock is roughly 61.4% undervalued, which indicates that the market may be heavily discounting the company’s ability to sustain and grow cash generation.
Result: UNDERVALUED
Our Discounted Cash Flow (DCF) analysis suggests DENTSPLY SIRONA is undervalued by 61.4%. Track this in your watchlist or portfolio, or discover 908 more undervalued stocks based on cash flows.
Approach 2: DENTSPLY SIRONA Price vs Sales
For companies that are still working through profitability issues but generate meaningful revenue, the price to sales ratio is often a more reliable yardstick than earnings based metrics. It lets us compare what investors are paying for each dollar of sales, regardless of temporary swings in profit margins.
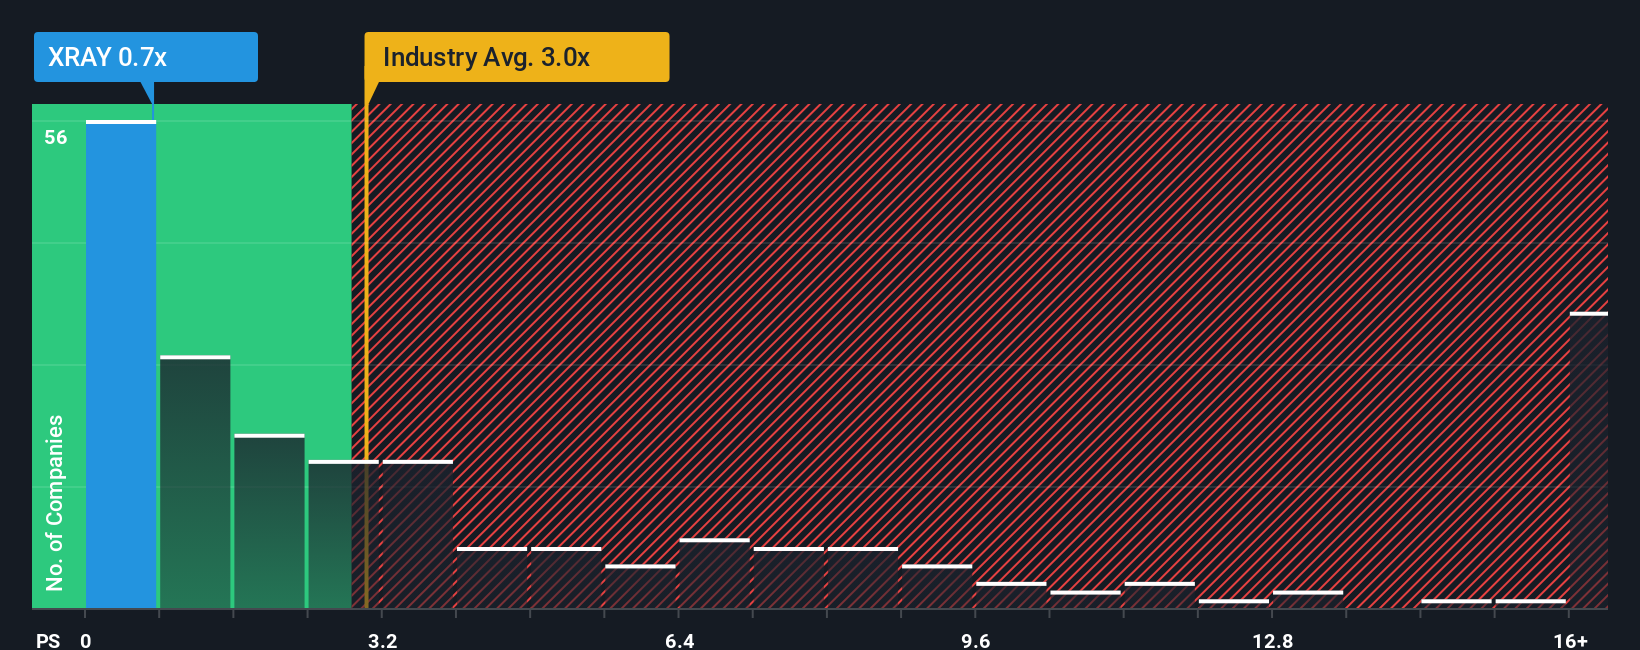
In general, businesses with stronger growth prospects and lower perceived risk tend to justify a higher sales multiple, while slower growing or riskier names deserve a discount. DENTSPLY SIRONA currently trades on a price to sales ratio of about 0.64x, which is well below both the Medical Equipment industry average of roughly 3.46x and the broader peer group average of about 5.19x.
Simply Wall St also applies a proprietary Fair Ratio. In this case it suggests DENTSPLY SIRONA “deserves” a price to sales multiple closer to 1.33x, after accounting for its growth outlook, profit margins, industry positioning, market cap and key risks. This tailored benchmark is more informative than a simple peer or industry comparison because it aligns the expected multiple with the company’s specific fundamentals. With the current 0.64x sitting materially below the 1.33x Fair Ratio, the shares screen as undervalued on this metric.
Result: UNDERVALUED
PS ratios tell one story, but what if the real opportunity lies elsewhere? Discover 1444 companies where insiders are betting big on explosive growth.
Upgrade Your Decision Making: Choose your DENTSPLY SIRONA Narrative
Earlier we mentioned that there is an even better way to understand valuation, so let us introduce you to Narratives, a simple way to connect your view of DENTSPLY SIRONA’s business with a concrete financial forecast and fair value estimate.
A Narrative is the story you believe about a company, translated into numbers such as future revenue, earnings, margins and the fair value you think those cash flows justify, rather than just accepting a single static target price.
On Simply Wall St’s Community page, used by millions of investors, Narratives make this process accessible by guiding you to link what you think will happen in the business to a set of forecasts and then to a fair value that you can compare with today’s share price to help inform a decision on whether to buy, hold or sell.
Because Narratives update dynamically when new information like earnings reports, news or guidance changes arrive, they stay aligned with the latest outlook. You can see at a glance how the most optimistic investors on DENTSPLY SIRONA, who might target around $24 per share, differ from the most cautious, who see fair value closer to $14. This can help you choose which story you agree with and how to position your portfolio.
Do you think there's more to the story for DENTSPLY SIRONA? Head over to our Community to see what others are saying!

This article by Simply Wall St is general in nature. We provide commentary based on historical data and analyst forecasts only using an unbiased methodology and our articles are not intended to be financial advice. It does not constitute a recommendation to buy or sell any stock, and does not take account of your objectives, or your financial situation. We aim to bring you long-term focused analysis driven by fundamental data. Note that our analysis may not factor in the latest price-sensitive company announcements or qualitative material. Simply Wall St has no position in any stocks mentioned.
Have feedback on this article? Concerned about the content? Get in touch with us directly. Alternatively, email editorial-team@simplywallst.com