
- PREMIUM
- LIVE QUOTES
- INSTITUTIONS
 Index Options
 State Street
 CME Group
 Nasdaq
 Cboe
Cboe TradingView
 Wall Street Journal
Assessing Wolters Kluwer’s Valuation After a 44.9% Share Price Slide in 2025
- Wondering if Wolters Kluwer is quietly turning into a value opportunity after a rough stretch? You are not alone. This is exactly what we are going to unpack here.
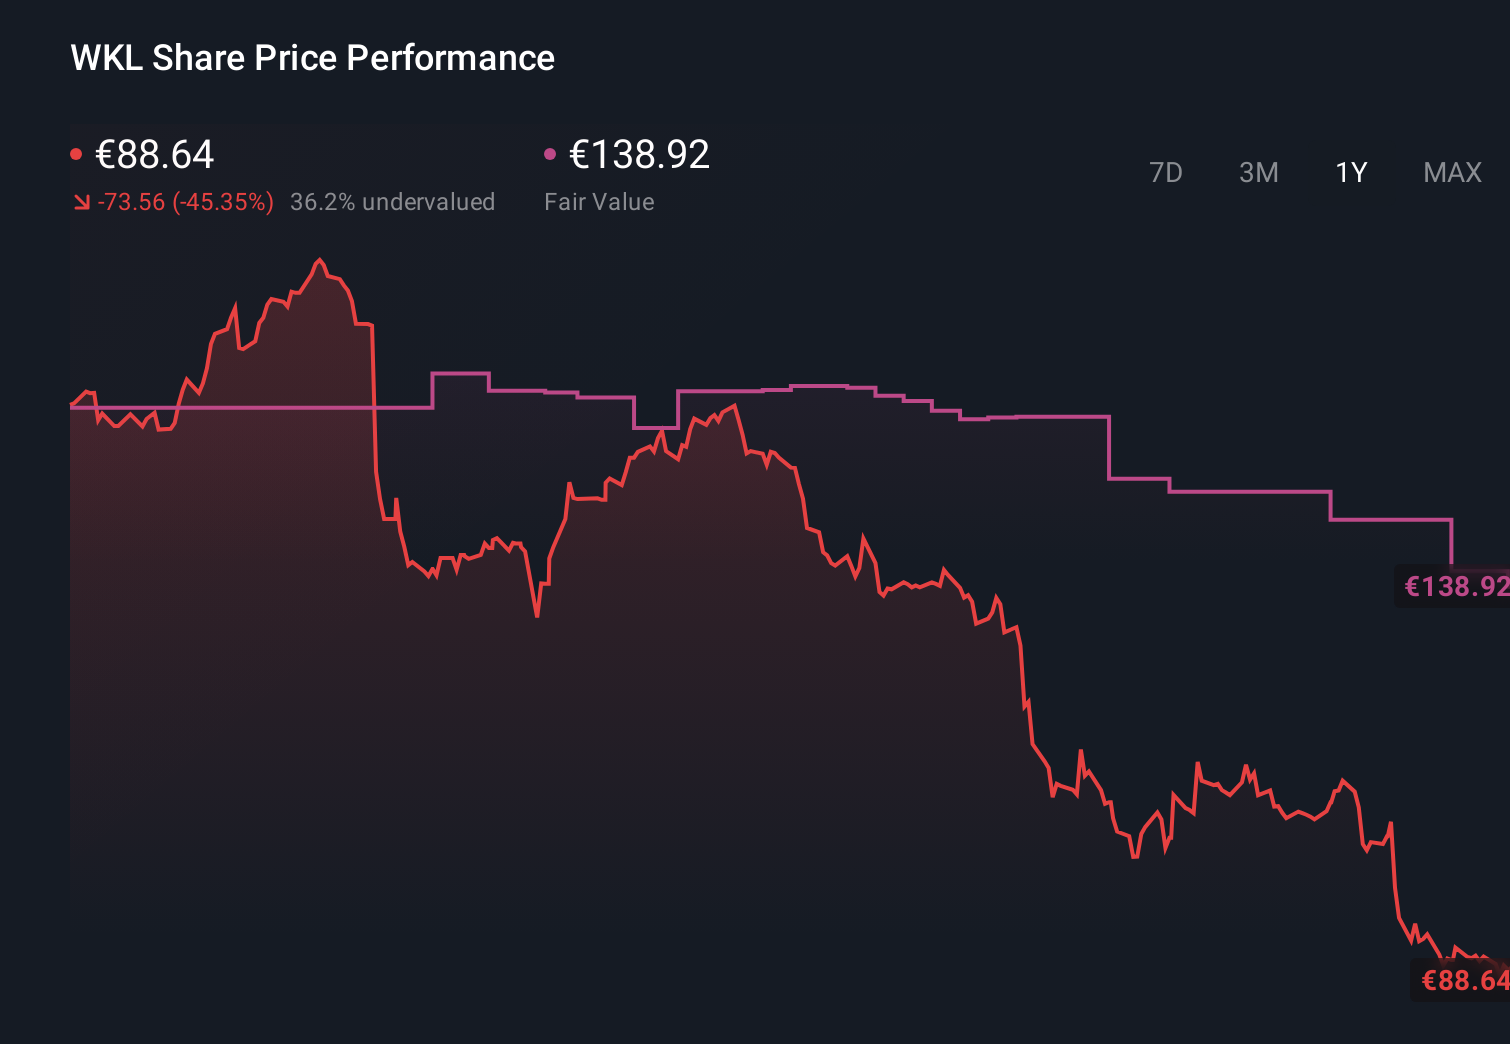
- The stock has slipped recently, down 1.6% over the last week, 5.0% over the past month, and about 44.9% year to date, even though it still sits about 39.3% higher than it was five years ago.
- Behind those moves, investors have been reacting to Wolters Kluwer's ongoing push into higher margin, software driven information solutions for legal, tax, and healthcare customers, and a steady drumbeat of bolt on acquisitions that aim to deepen its data and analytics offerings. At the same time, the market has been reassessing how much to pay for stable, recurring revenue businesses as interest rates and risk appetite have shifted.
- Despite the share price pressure, Wolters Kluwer currently scores a full 6/6 on our valuation checks, suggesting it screens as undervalued across every metric we use. Next, we will walk through those valuation methods one by one, and then circle back at the end to a more practical, big picture way of thinking about what the stock is really worth.
Find out why Wolters Kluwer's -44.3% return over the last year is lagging behind its peers.
Approach 1: Wolters Kluwer Discounted Cash Flow (DCF) Analysis
The Discounted Cash Flow model projects the cash Wolters Kluwer can generate in the future and then discounts those cash flows back to a single value in today’s money.
Over the last twelve months, Wolters Kluwer generated about €1.37 billion in free cash flow, a solid base for a mature software and information services business. Analysts expect free cash flow to keep rising, with projections reaching roughly €1.71 billion by 2029. Beyond the first few years, Simply Wall St extends these analyst estimates out over a full decade, gradually slowing the growth rate to reflect a more mature business profile.
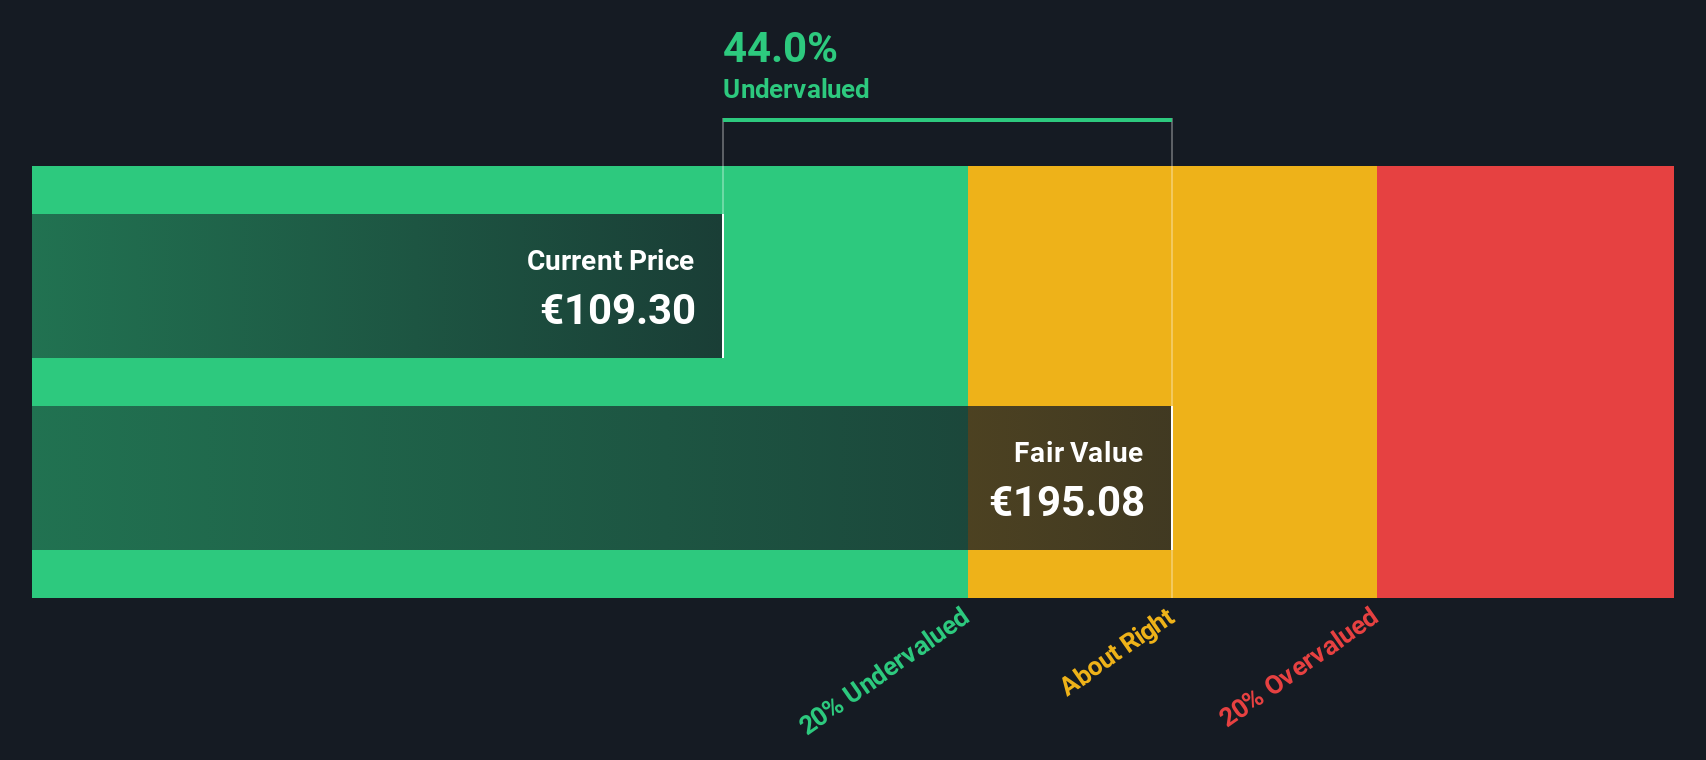
When all those future cash flows are discounted back using the 2 Stage Free Cash Flow to Equity model, the intrinsic value comes out to about €192.37 per share. That implies the stock is trading at a 53.8% discount to its estimated fair value, suggesting the market is currently pricing Wolters Kluwer well below the long term cash it is expected to generate.
Result: UNDERVALUED
Our Discounted Cash Flow (DCF) analysis suggests Wolters Kluwer is undervalued by 53.8%. Track this in your watchlist or portfolio, or discover 903 more undervalued stocks based on cash flows.
Approach 2: Wolters Kluwer Price vs Earnings
For a profitable, established business like Wolters Kluwer, the price to earnings ratio is a practical way to gauge how much investors are willing to pay today for each euro of current profits. It effectively blends the market’s view on growth prospects and business quality into a single, intuitive number.
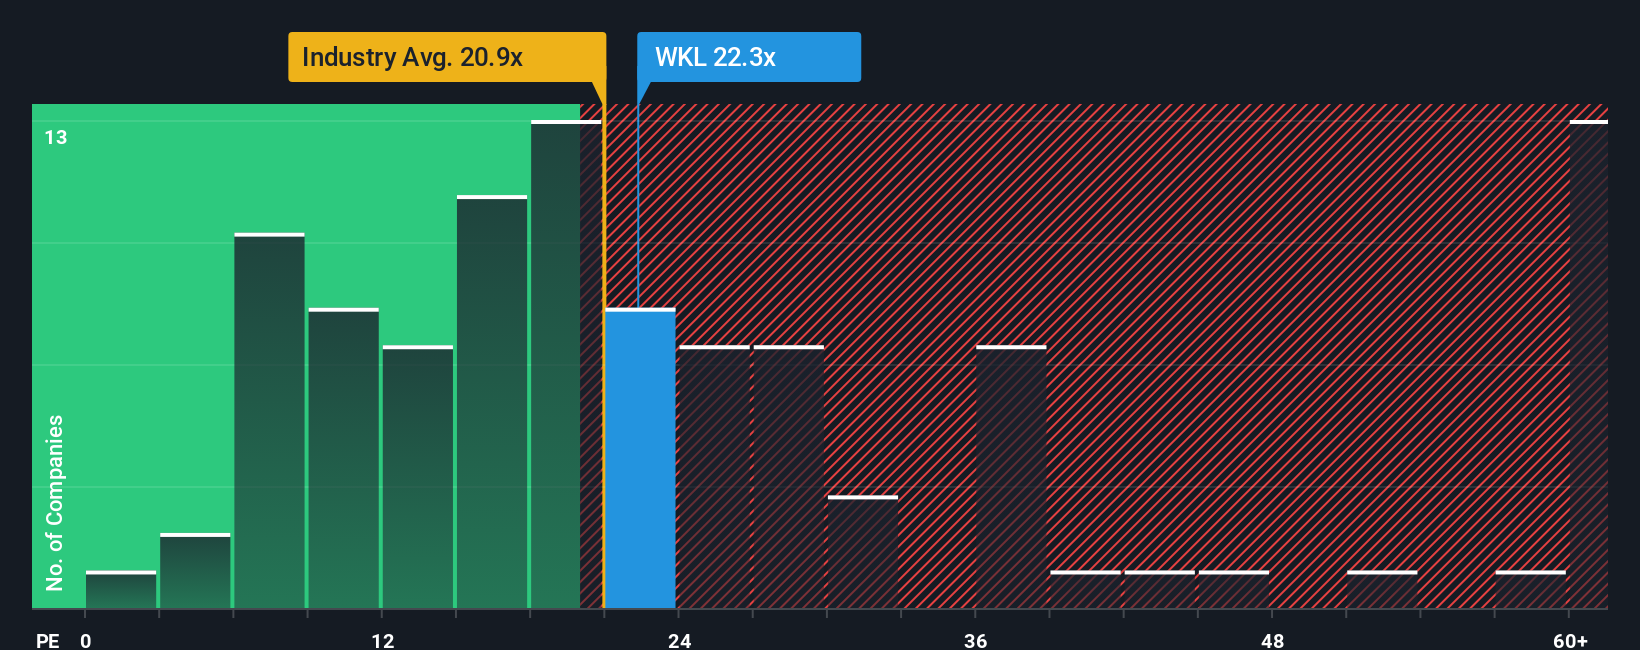
In general, faster growing and lower risk companies should justify a higher PE ratio, while slower growth or higher uncertainty should pull that multiple down. Wolters Kluwer currently trades on about 17.95x earnings, which is slightly above the Professional Services industry average of 17.39x, but well below the broader peer group average of roughly 45.25x. That gap suggests the market is giving the company only a modest premium to its sector, despite its scale and software driven model.
Simply Wall St’s Fair Ratio framework refines this comparison by estimating what PE multiple a stock should trade on, after accounting for its earnings growth outlook, profitability, industry positioning, market cap and specific risks. For Wolters Kluwer, that Fair Ratio is 20.74x, noticeably higher than the current 17.95x. On this basis, the shares appear undervalued relative to where they might typically trade given their fundamentals.
Result: UNDERVALUED
PE ratios tell one story, but what if the real opportunity lies elsewhere? Discover 1442 companies where insiders are betting big on explosive growth.
Upgrade Your Decision Making: Choose your Wolters Kluwer Narrative
Earlier we mentioned that there is an even better way to understand valuation, so let us introduce you to Narratives, a simple way to connect your view of Wolters Kluwer’s business with a set of numbers for future revenue, earnings, margins and a fair value estimate.
A Narrative is essentially your story about the company, translated into a financial forecast and then into a fair value, so you can clearly see how beliefs about cloud adoption, GenAI products or buybacks might justify, for example, a higher or lower PE ratio in a few years’ time.
On Simply Wall St’s Community page, used by millions of investors, Narratives are an easy, guided tool that help you compare your fair value with today’s share price to consider whether Wolters Kluwer might be a buy, a hold or a sell under your specific assumptions.
Because Narratives are refreshed when new earnings, news or guidance arrive, you can quickly see how fair value shifts if, for example, investors who expect a move toward €175 and those who expect a level closer to €117 update their views in light of new data, and then judge where your own expectations sit between those ranges.
Do you think there's more to the story for Wolters Kluwer? Head over to our Community to see what others are saying!
This article by Simply Wall St is general in nature. We provide commentary based on historical data and analyst forecasts only using an unbiased methodology and our articles are not intended to be financial advice. It does not constitute a recommendation to buy or sell any stock, and does not take account of your objectives, or your financial situation. We aim to bring you long-term focused analysis driven by fundamental data. Note that our analysis may not factor in the latest price-sensitive company announcements or qualitative material. Simply Wall St has no position in any stocks mentioned.
Have feedback on this article? Concerned about the content? Get in touch with us directly. Alternatively, email editorial-team@simplywallst.com