
- PREMIUM
- LIVE QUOTES
- INSTITUTIONS
 Index Options
 State Street
 CME Group
 Nasdaq
 Cboe
Cboe TradingView
 Wall Street Journal
Sa Sa International (SEHK:178) H1 EPS Growth Tests Market’s High-Multiple, Margin-Skeptic Narrative
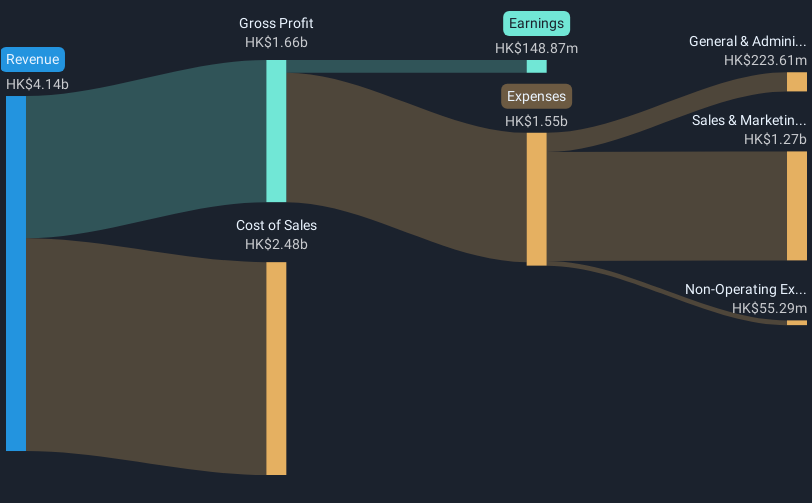
Sa Sa International Holdings (SEHK:178) has just posted its H1 2026 numbers, with revenue coming in at HK$2.0 billion and basic EPS at HK$0.017, giving investors a fresh data point on the retailer’s post reopening trajectory. The company has seen revenue move from HK$1.9 billion in H1 2025 to HK$2.0 billion in H1 2026, while basic EPS has edged from HK$0.015 to HK$0.017 over the same period. This sets the stage for a debate about how durable its improving profitability really is as margins remain in focus.
See our full analysis for Sa Sa International Holdings.With the latest figures on the table, the next step is to weigh these results against the dominant market narratives around Sa Sa, seeing where the story holds up and where the numbers start to push back.
Curious how numbers become stories that shape markets? Explore Community Narratives
Net profit margins compressed to 2%
- Over the trailing 12 months, Sa Sa generated HK$4,065.4 million in revenue and HK$82.4 million in net income from continuing operations, which works out to a 2% net profit margin compared with 4% a year earlier.
- Bears argue that weaker profitability will be hard to reverse, and the margin data partially backs that caution:
- The H1 2026 net income from continuing operations of HK$52.9 million sits within an 82.4 million trailing total, showing that recent profit is much thinner relative to the HK$4,065.4 million revenue base than it was when margins were 4%.
- At the same time, the business has grown earnings at about 62.9% per year over the past five years, which challenges a purely bearish view that the model cannot generate stronger profits when conditions are more favorable.
Earnings forecasts outpace 3.7% sales growth
- Looking ahead, revenue is forecast to grow around 3.7% per year, while earnings are expected to increase roughly 18.1% per year, a faster pace than the wider Hong Kong market’s 12.2% expected earnings growth.
- Bullish investors see this gap between revenue and earnings growth as a sign of improving efficiency, and the numbers give them some support:
- From H1 2025 to H1 2026, revenue rose from HK$1,866.9 million to HK$1,990.6 million and net income from continuing operations moved from HK$47.5 million to HK$52.9 million, so profits have been growing faster than sales over these recent halves.
- On a trailing basis, earnings growth of 18.1% per year still sits well above the 3.7% revenue forecast, which heavily supports the bullish case that profit can keep compounding even if top line expansion stays modest.
Premium 22.6x P/E versus peers
- At a share price of HK$0.60, Sa Sa trades on a trailing P/E of 22.6 times, which is well above the Hong Kong Specialty Retail industry average of 11.7 times and the peer average of 14.6 times, and above a DCF fair value estimate of HK$0.39.
- Critics highlight this premium valuation as a key risk, and several figures underline why they are worried:
- The stock is priced higher than the DCF fair value of HK$0.39, so the current multiple already assumes that the forecast 18.1% annual earnings growth will be delivered despite the present 2% net margin.
- The trailing dividend yield of 5.67% is not well covered by current earnings, which challenges the idea that today’s 22.6 times earnings multiple is backed by both strong profitability and comfortably funded shareholder payouts.
Next Steps
Don't just look at this quarter; the real story is in the long-term trend. We've done an in-depth analysis on Sa Sa International Holdings's growth and its valuation to see if today's price is a bargain. Add the company to your watchlist or portfolio now so you don't miss the next big move.
Explore Alternatives
Sa Sa’s thin 2% margins, overstretched dividend cover and premium P E suggest investors are paying up today for earnings that still have plenty to prove.
If you do not want to rely on fragile payouts or stretched valuations, use our these 1910 dividend stocks with yields > 3% to quickly uncover income ideas with stronger, more sustainable dividend support.
This article by Simply Wall St is general in nature. We provide commentary based on historical data and analyst forecasts only using an unbiased methodology and our articles are not intended to be financial advice. It does not constitute a recommendation to buy or sell any stock, and does not take account of your objectives, or your financial situation. We aim to bring you long-term focused analysis driven by fundamental data. Note that our analysis may not factor in the latest price-sensitive company announcements or qualitative material. Simply Wall St has no position in any stocks mentioned.
Have feedback on this article? Concerned about the content? Get in touch with us directly. Alternatively, email editorial-team@simplywallst.com