
- PREMIUM
- LIVE QUOTES
- INSTITUTIONS
 Index Options
 State Street
 CME Group
 Nasdaq
 Cboe
Cboe TradingView
 Wall Street Journal
Assessing Oceaneering’s Valuation After Strong Multi‑Year Gains and Subsea Robotics Momentum
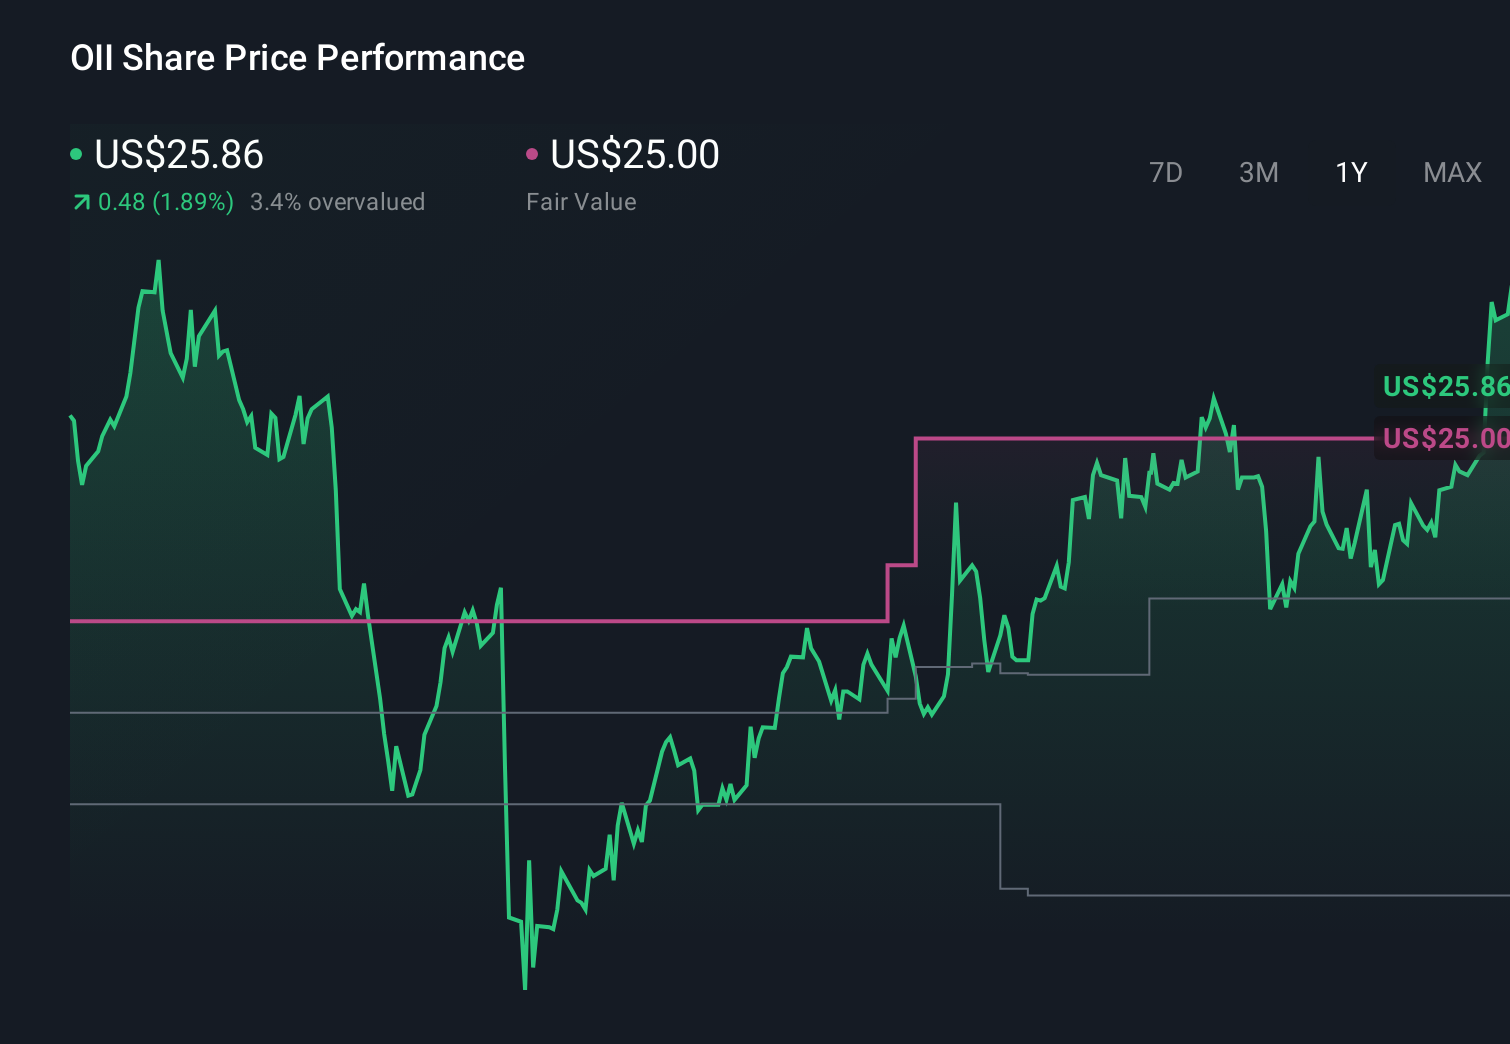
- Wondering if Oceaneering International at around $26 a share is still a smart buy, or if the big gains are already behind it? You are in the right place to unpack what the current price really implies.
- The stock has slipped about 3.3% over the last week but is still up 11.7% over the past month. This follows a flat 0.7% gain over the last year and a much stronger 79.9% and 215.4% over the past 3 and 5 years respectively, a mix that hints at both consolidation and long term momentum.
- Recent headlines have highlighted steady contract wins in offshore services and continued investment in subsea robotics and autonomy. This reinforces the idea that Oceaneering is positioning itself for the next leg of offshore and energy infrastructure spending. At the same time, market commentary has focused on how its backlog and technology heavy offerings may insulate it somewhat from short term swings in energy prices, which helps explain the share price resilience despite choppy sector sentiment.
- On our checks, Oceaneering scores a 4/6 valuation score, suggesting the market may not be fully pricing in its fundamentals just yet. Next we will walk through the main valuation approaches before finishing with a more complete way to think about what the stock is really worth.
Find out why Oceaneering International's 0.7% return over the last year is lagging behind its peers.
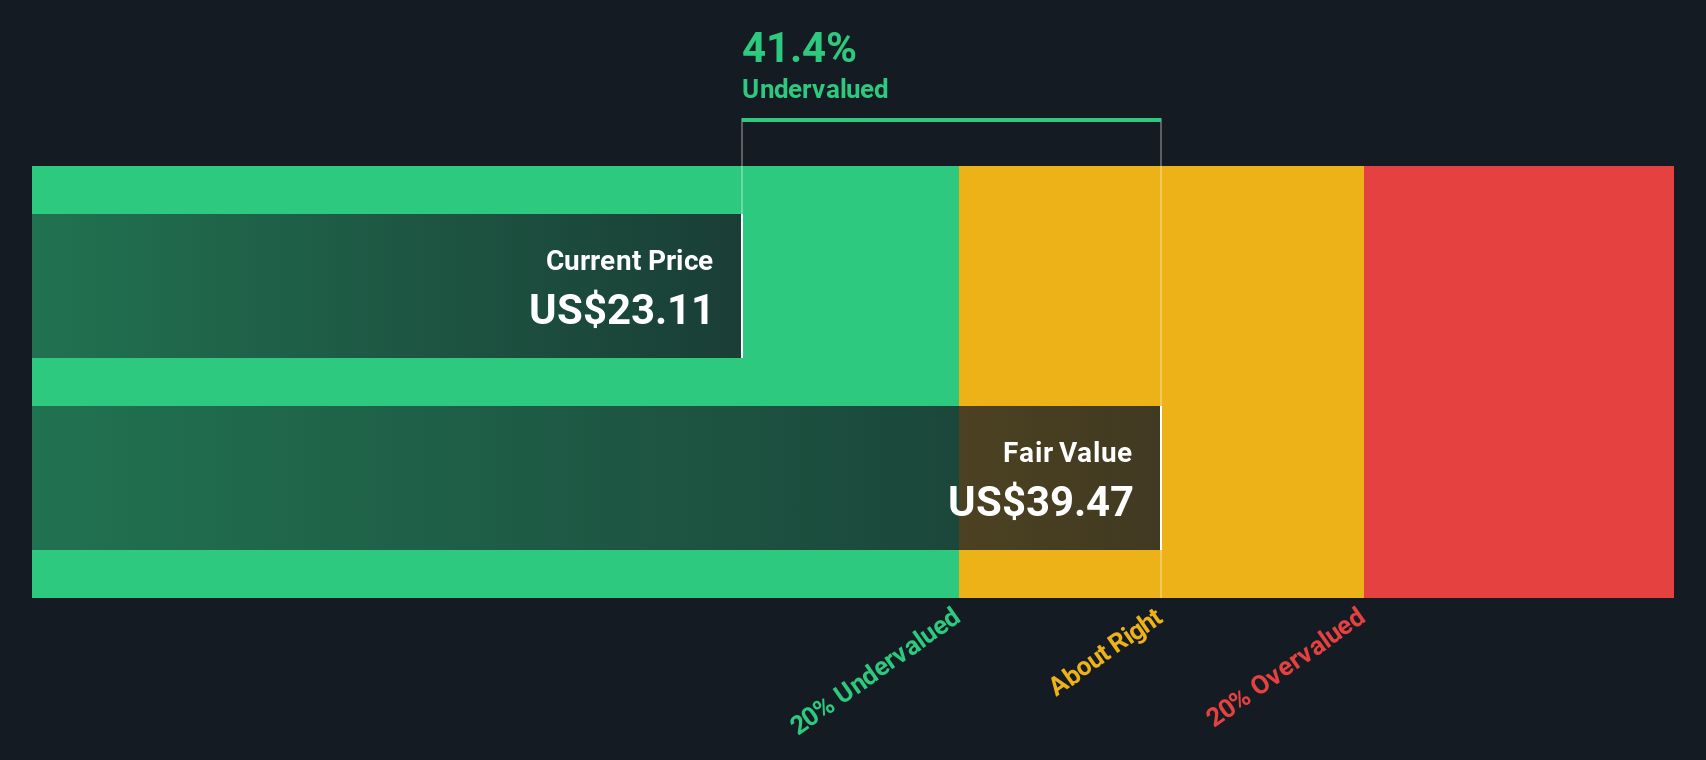
Approach 1: Oceaneering International Discounted Cash Flow (DCF) Analysis
A Discounted Cash Flow, or DCF, model estimates what a company is worth by projecting the cash it can generate in the future and discounting those cash flows back to today. For Oceaneering International, the model starts with last twelve month Free Cash Flow of about $111 million and then layers on analyst forecasts plus longer term projections.
Analysts expect Free Cash Flow to climb steadily over the next several years, with projections such as roughly $146 million in 2026 and $184 million in 2027. Simply Wall St then extrapolates beyond the analyst window, with FCF estimated to reach about $311 million by 2035, all in $. These future cash flows are discounted to reflect risk and the time value of money, and then summed.
On this basis, the DCF model points to an intrinsic value of roughly $51.43 per share, compared with a market price around $26. That implies the stock trades at about a 49.3% discount to its estimated fair value, suggesting meaningful upside if these cash flow projections prove accurate.
Result: UNDERVALUED
Our Discounted Cash Flow (DCF) analysis suggests Oceaneering International is undervalued by 49.3%. Track this in your watchlist or portfolio, or discover 907 more undervalued stocks based on cash flows.
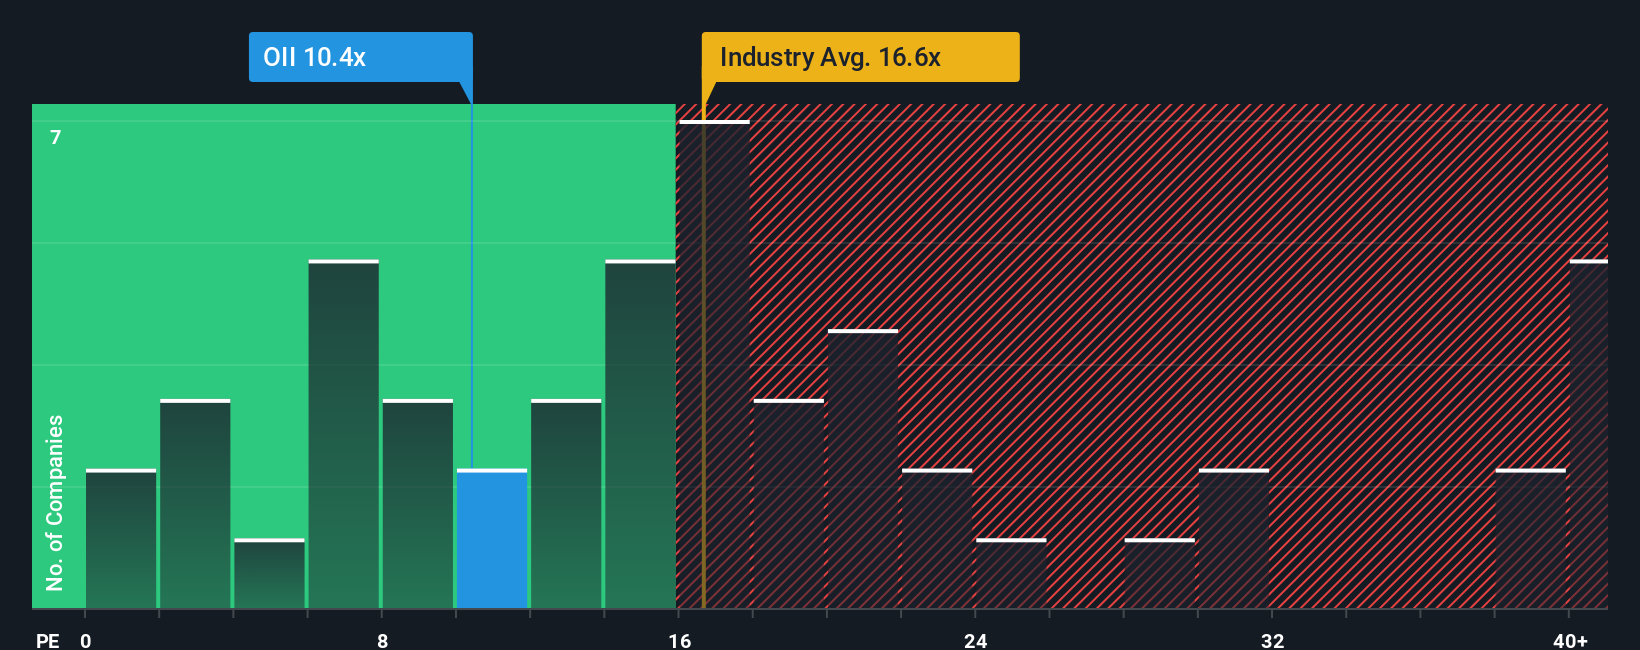
Approach 2: Oceaneering International Price vs Earnings
For a company that is solidly profitable like Oceaneering International, the Price to Earnings, or PE, ratio is a useful way to gauge how much investors are paying for each dollar of current earnings. In general, faster growing and lower risk businesses deserve a higher PE, while slower or riskier ones should trade on a lower multiple, so there is no single “correct” number in isolation.
Oceaneering currently trades on a PE of about 11.2x, which is well below both the Energy Services industry average of roughly 18.4x and a broader peer group closer to 38.5x. Rather than stopping at those simple comparisons, Simply Wall St also calculates a proprietary “Fair Ratio”, which is the PE you would reasonably expect once you factor in the company’s earnings growth outlook, risk profile, profit margins, industry characteristics and market cap. This Fair Ratio framework is more robust than a plain peer or sector check because it recognises that two companies in the same industry can justifiably deserve very different multiples.
On this basis, Oceaneering’s current 11.2x PE sits below its Fair Ratio, which points to the shares being undervalued on earnings.
Result: UNDERVALUED
PE ratios tell one story, but what if the real opportunity lies elsewhere? Discover 1448 companies where insiders are betting big on explosive growth.
Upgrade Your Decision Making: Choose your Oceaneering International Narrative
Earlier we mentioned that there is an even better way to understand valuation, so let us introduce you to Narratives, which are simply your story about a company linked directly to the numbers you think are reasonable for its future revenues, earnings, margins and fair value. A Narrative connects three pieces together: the business story you believe, the financial forecast that flows from that story, and then the fair value you get when you discount those expectations back to today. On Simply Wall St, Narratives are an easy to use, dynamic tool on the Community page that millions of investors use to see how their view of a stock translates into a Fair Value they can compare with the current Price to decide whether to buy, hold or sell. Because Narratives update as new news, contracts or earnings come in, your fair value view evolves with the facts; for example, one Oceaneering Narrative might argue the global energy transition caps long term offshore demand and point to fair value near $17.50, while another focuses on defense growth, robotics strength and recurring contracts to support a fair value closer to $25.00.
Do you think there's more to the story for Oceaneering International? Head over to our Community to see what others are saying!
This article by Simply Wall St is general in nature. We provide commentary based on historical data and analyst forecasts only using an unbiased methodology and our articles are not intended to be financial advice. It does not constitute a recommendation to buy or sell any stock, and does not take account of your objectives, or your financial situation. We aim to bring you long-term focused analysis driven by fundamental data. Note that our analysis may not factor in the latest price-sensitive company announcements or qualitative material. Simply Wall St has no position in any stocks mentioned.
Have feedback on this article? Concerned about the content? Get in touch with us directly. Alternatively, email editorial-team@simplywallst.com