
- PREMIUM
- LIVE QUOTES
- INSTITUTIONS
 Index Options
 State Street
 CME Group
 Nasdaq
 Cboe
Cboe TradingView
 Wall Street Journal
Has The Market Mispriced SM Energy After A 51% Slide And Bullish Cash Flow Outlook?
- Wondering if SM Energy is a bargain or a value trap at current levels? You are not alone, and this is exactly the kind of setup where a closer look at valuation can really pay off.
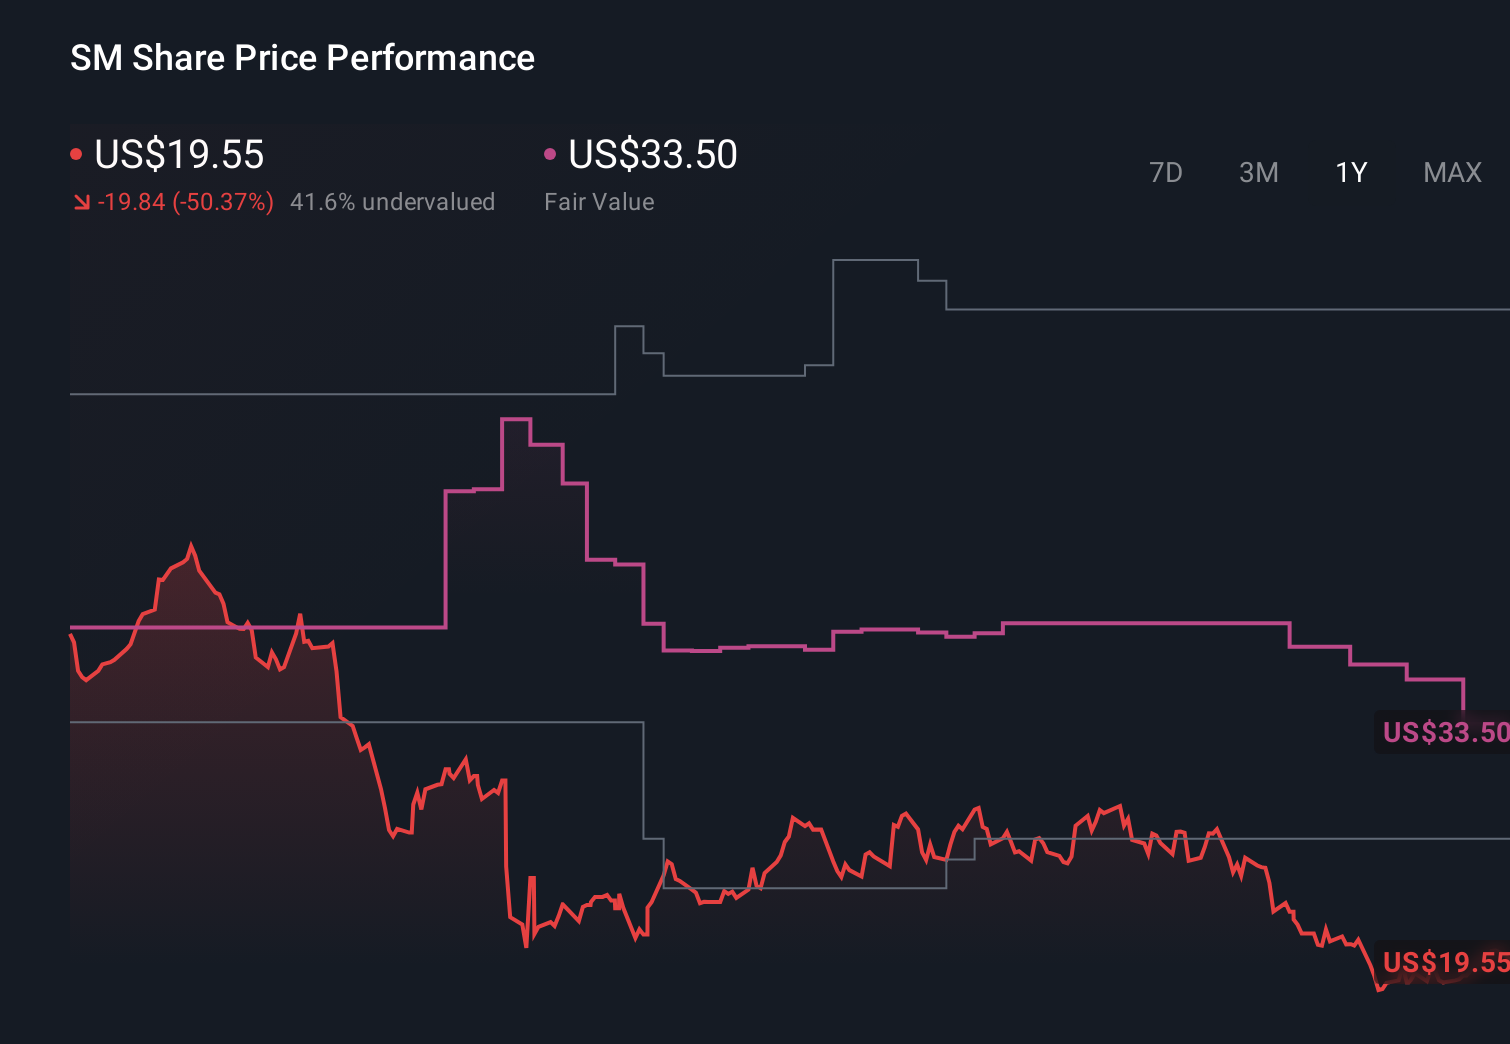
- The stock has been choppy, slipping around 2.8% over the last week but still up 6.7% in the past month. It remains down sharply at around -51.3% year to date and -50.1% over the last year, with a hefty 262.7% gain over five years reminding investors how quickly sentiment can flip in energy names.
- Recently, SM Energy has stayed on investors radar as the energy sector keeps reacting to shifting oil and gas price expectations and changing capital discipline across US shale producers. Sector wide headlines around production strategies, balance sheet priorities, and long term supply dynamics have all helped frame why a name like SM can swing so hard when the market updates its view on risk and growth.
- On our numbers, SM Energy scores a solid 5/6 valuation score, meaning it screens as undervalued on most of our key checks. Next, we will unpack those methods in detail, before finishing with a more holistic way to think about what the stock is really worth beyond the headline multiples.
Find out why SM Energy's -50.1% return over the last year is lagging behind its peers.
Approach 1: SM Energy Discounted Cash Flow (DCF) Analysis
A Discounted Cash Flow, or DCF, model estimates what a company is worth by projecting its future cash flows and discounting them back to todays dollars. For SM Energy, the model uses a 2 Stage Free Cash Flow to Equity framework built on analyst forecasts and longer term extrapolations.
SM Energy currently has trailing twelve month free cash flow of around $307 million negative, reflecting recent investment and commodity volatility. Looking ahead, analysts and model extensions see this swinging firmly positive, with projected free cash flow of about $1.39 billion in 2026 and roughly $1.83 billion by 2035 as production and pricing normalize.
When all those future cash flows are discounted back, Simply Wall St estimates an intrinsic value of about $259.34 per share. Compared with the current market price, this implies the stock is roughly 92.5% undervalued, suggesting investors are heavily discounting SM Energys long term cash generation potential.
Result: UNDERVALUED
Our Discounted Cash Flow (DCF) analysis suggests SM Energy is undervalued by 92.5%. Track this in your watchlist or portfolio, or discover 907 more undervalued stocks based on cash flows.
Approach 2: SM Energy Price vs Earnings
For a profitable company like SM Energy, the price to earnings, or PE, ratio is a practical way to gauge how much investors are paying for each dollar of current earnings. It works especially well when earnings are positive and reasonably stable, as it ties valuation directly to the business results that ultimately support the share price.
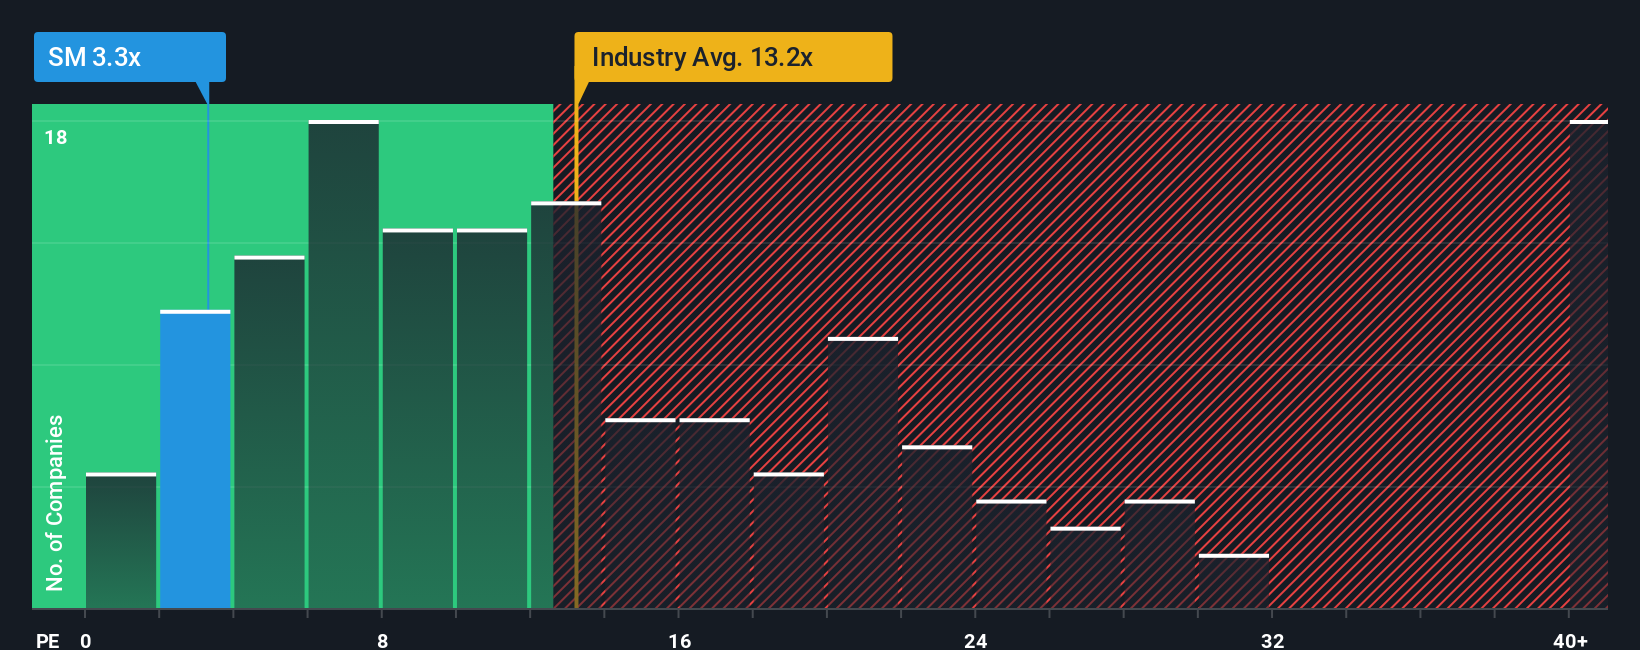
What counts as a fair PE depends on how fast earnings are expected to grow and how risky those earnings are. Higher growth and more predictable cash flows usually justify a higher multiple, while volatile or uncertain outlooks tend to drag the PE down. SM Energy currently trades on a very low PE of about 3.1x, compared with the Oil and Gas industry average of roughly 13.3x and a much richer peer average of around 34.1x, signalling that the market is pricing the stock far more cautiously than many competitors.
Simply Wall St’s Fair Ratio tackles this directly by estimating what PE the stock should trade on, given its earnings growth profile, margins, industry, market cap and risk factors. For SM Energy, that Fair Ratio sits at about 17.4x, well above the current 3.1x. On this view, the stock looks materially undervalued even after accounting for its sector risks.
Result: UNDERVALUED
PE ratios tell one story, but what if the real opportunity lies elsewhere? Discover 1448 companies where insiders are betting big on explosive growth.
Upgrade Your Decision Making: Choose your SM Energy Narrative
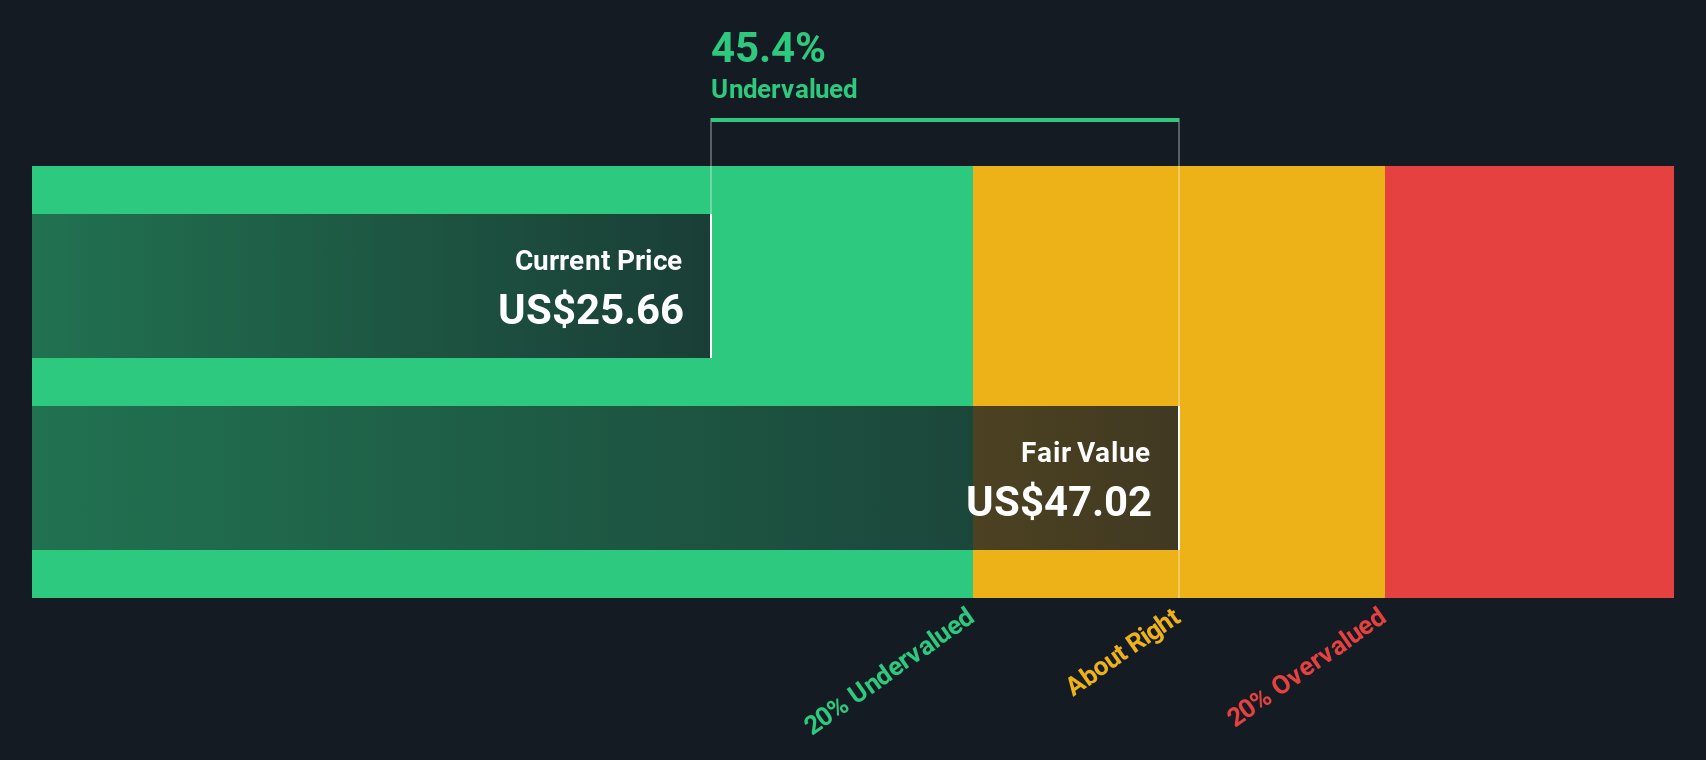
Earlier we mentioned that there is an even better way to understand valuation, so let us introduce you to Narratives, a simple framework on Simply Wall St’s Community page that helps you turn your view of SM Energy into a story linked to a financial forecast and a fair value. You can compare that fair value to today’s price and decide when to buy or sell, while the Narrative itself automatically updates as new news or earnings arrive. Different investors, for example, might see SM Energy as a high conviction compounding story with strong free cash flow, margin resilience and merger driven upside that could justify a fair value near the top end of recent targets around 59 dollars. Others may see it as a riskier shale producer exposed to regional bottlenecks, margin compression and transition headwinds that supports a far more conservative fair value closer to 27 dollars.
Do you think there's more to the story for SM Energy? Head over to our Community to see what others are saying!
This article by Simply Wall St is general in nature. We provide commentary based on historical data and analyst forecasts only using an unbiased methodology and our articles are not intended to be financial advice. It does not constitute a recommendation to buy or sell any stock, and does not take account of your objectives, or your financial situation. We aim to bring you long-term focused analysis driven by fundamental data. Note that our analysis may not factor in the latest price-sensitive company announcements or qualitative material. Simply Wall St has no position in any stocks mentioned.
Have feedback on this article? Concerned about the content? Get in touch with us directly. Alternatively, email editorial-team@simplywallst.com