
- PREMIUM
- LIVE QUOTES
- INSTITUTIONS
 Index Options
 State Street
 CME Group
 Nasdaq
 Cboe
Cboe TradingView
 Wall Street Journal
Has the Market Overreacted to Recent Mondelez Share Weakness?
- Wondering if Mondelez International is quietly turning into a value opportunity while the market looks elsewhere? You are not alone.
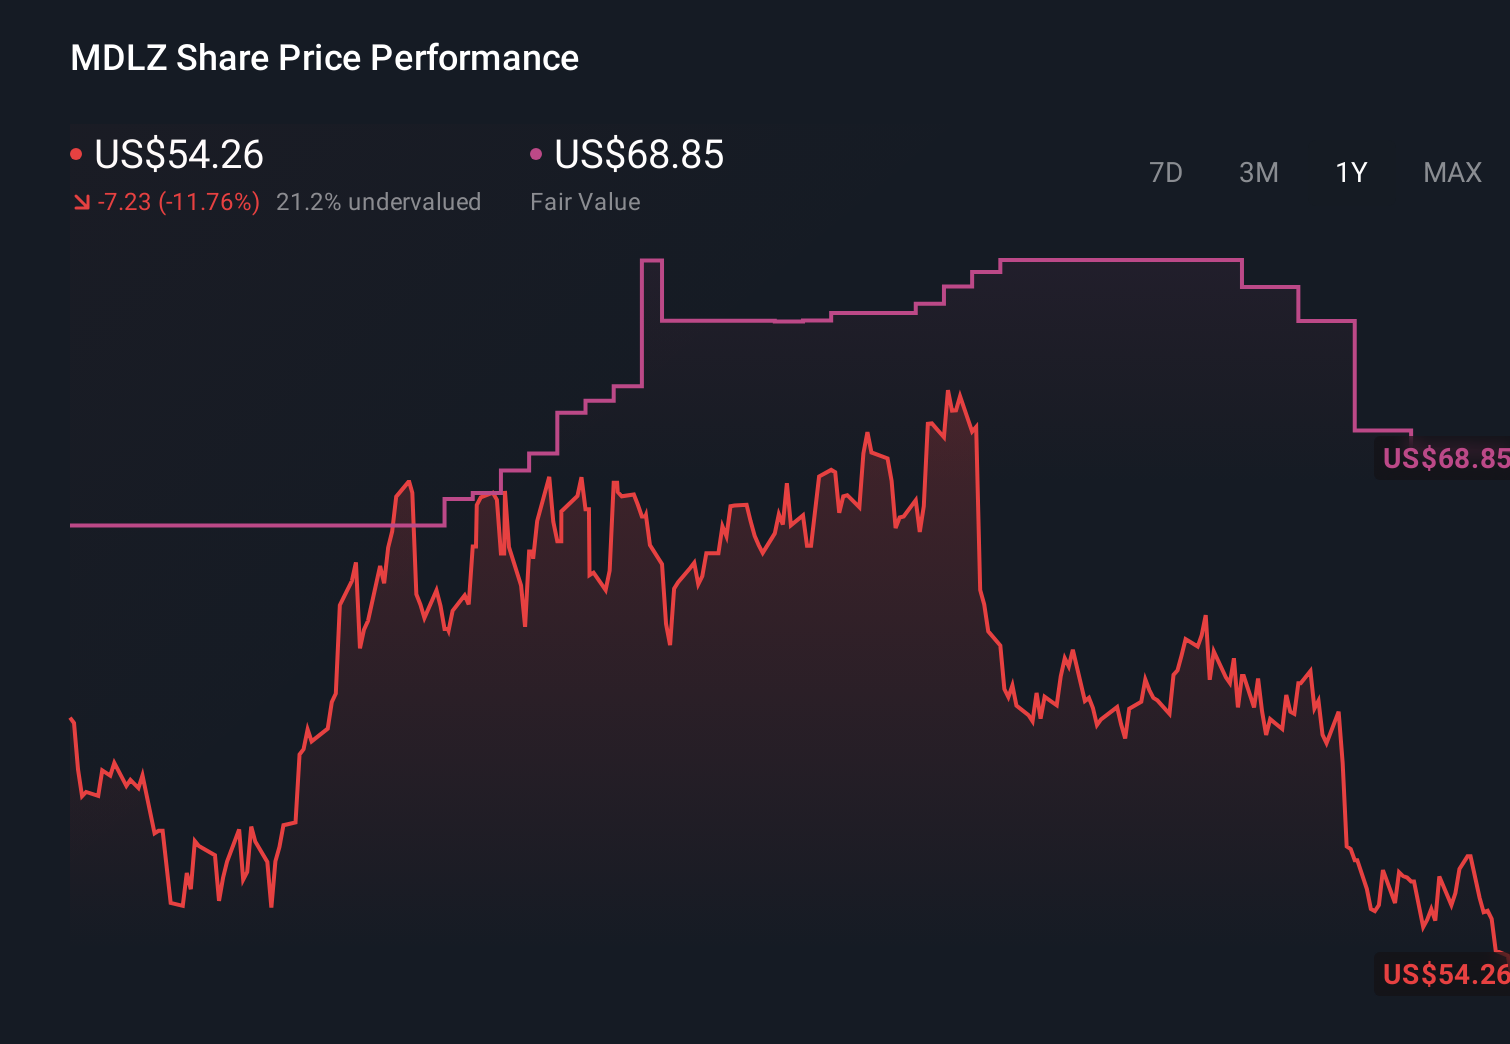
- The stock is down around 1.6% over the last week, 5.2% over the past month, and roughly 9.2% year to date. It is about 10.1% lower than a year ago despite being modestly positive, up 4.7%, over five years.
- Recently, investors have been digesting a mix of macro headlines around consumer spending, shifting brand loyalty in snacks and confectionery, and ongoing cost inflation across ingredients and logistics. At the same time, Mondelez has stayed active with portfolio reshaping and brand investment moves that aim to keep its core snack franchises resilient even as the market narrative turns a bit more cautious on defensive consumer names.
- All of this sets up an interesting puzzle, because on our framework Mondelez scores a full 6/6 on our valuation checks. This suggests the current weakness may not tell the whole story. Next, we will walk through the main valuation approaches investors use and then finish with a more powerful way to think about what the stock is really worth.
Approach 1: Mondelez International Discounted Cash Flow (DCF) Analysis
A Discounted Cash Flow model estimates what a company is worth by projecting the cash it can generate in the future and then discounting those cash flows back to today in dollar terms.
For Mondelez International, the latest twelve month free cash flow is around $2.3 billion. Analysts expect this to rise steadily, with Simply Wall St projecting free cash flow to reach about $7.5 billion in 2035 as earlier analyst estimates roll off and longer term numbers are extrapolated. These projections are run through a 2 Stage Free Cash Flow to Equity model, which assumes a higher growth period followed by a more mature phase.
After discounting all those future cash flows to today, the model arrives at an intrinsic value of roughly $113.95 per share. Compared with the current market price, this implies the shares are about 52.6% undervalued on a cash flow basis, suggesting a margin of safety if the projections prove broadly accurate.
Result: UNDERVALUED
Our Discounted Cash Flow (DCF) analysis suggests Mondelez International is undervalued by 52.6%. Track this in your watchlist or portfolio, or discover 907 more undervalued stocks based on cash flows.

Approach 2: Mondelez International Price vs Earnings
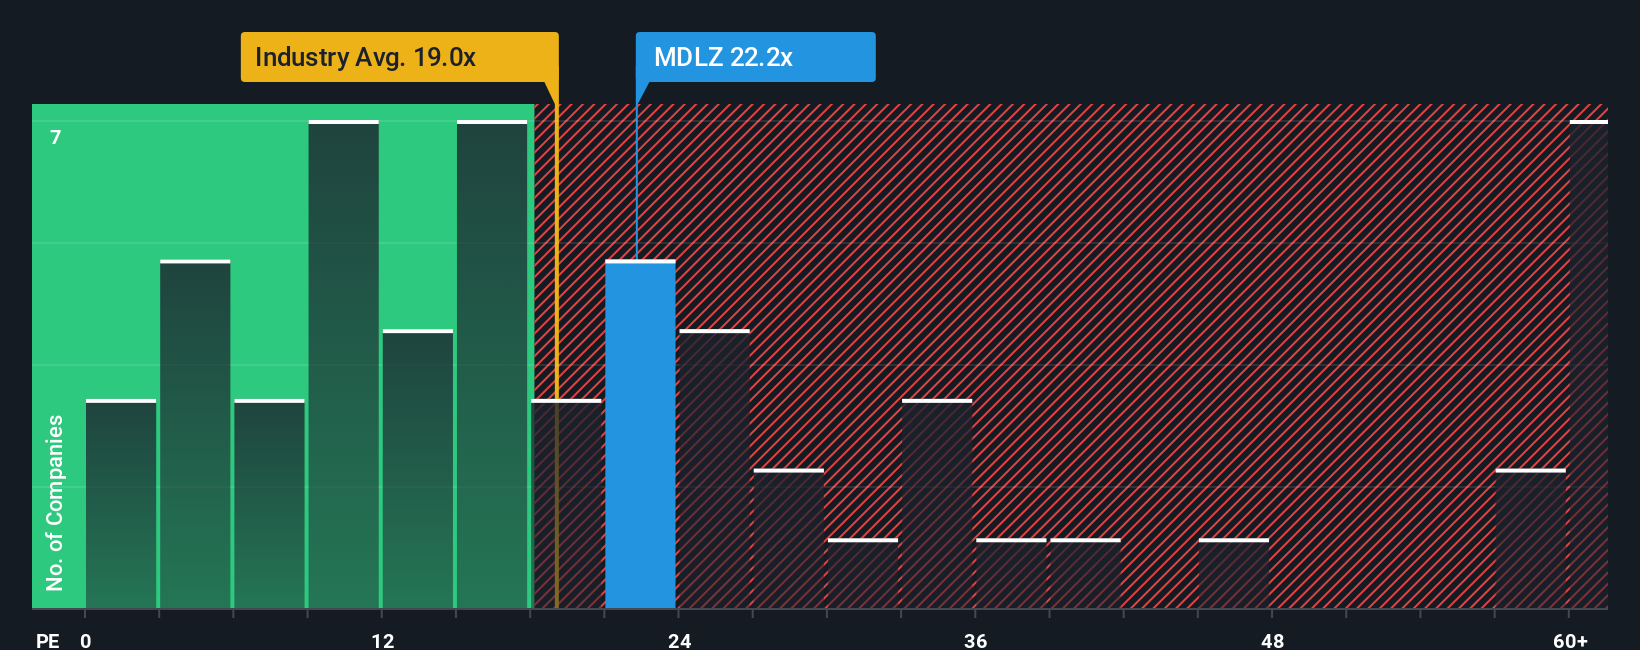
For an established, consistently profitable business like Mondelez International, the price to earnings ratio is a straightforward way to gauge what investors are willing to pay for each dollar of current earnings. In general, companies with stronger growth prospects and lower perceived risk tend to justify higher PE ratios, while slower growth or higher uncertainty should be reflected in lower multiples.
Mondelez currently trades at about 19.7x earnings, which is slightly below the broader Food industry average of roughly 20.2x and meaningfully below the peer group average near 25.8x. That already hints at some relative value, but simple comparisons like these can miss important differences in growth, margins and risk between companies.
To address that, Simply Wall St uses a proprietary “Fair Ratio” framework. This framework estimates what PE multiple a company might trade on after accounting for its earnings growth outlook, profitability, risk profile, industry and market cap. For Mondelez, this Fair Ratio is around 22.5x, higher than the current 19.7x market multiple. On this basis, the stock screens as undervalued on earnings, suggesting the market is not fully recognising the company’s quality and growth prospects.
Result: UNDERVALUED
PE ratios tell one story, but what if the real opportunity lies elsewhere? Discover 1448 companies where insiders are betting big on explosive growth.
Upgrade Your Decision Making: Choose your Mondelez International Narrative
Earlier we mentioned that there is an even better way to understand valuation, so let us introduce you to Narratives, an easy tool on Simply Wall St’s Community page that lets you connect your story about Mondelez International to concrete assumptions for future revenue, earnings and margins. This turns those assumptions into a fair value you can compare with today’s price to help you decide whether to buy, hold or sell.
A Narrative is simply your perspective written into the numbers. It links what you believe about Mondelez’s pricing power, brand strength and cost pressures to a forecast, and then automatically to a fair value that updates as new news or earnings arrive.
For example, one investor might build a bullish Mondelez Narrative that assumes cocoa costs ease and AI driven efficiency lifts margins. This might justify a fair value closer to the high analyst target of $88. A more cautious investor, worried about weak volumes and soft consumer demand, might land nearer the low target of $67. Both investors can clearly see how their views translate into numbers and a price signal.
Do you think there's more to the story for Mondelez International? Head over to our Community to see what others are saying!
This article by Simply Wall St is general in nature. We provide commentary based on historical data and analyst forecasts only using an unbiased methodology and our articles are not intended to be financial advice. It does not constitute a recommendation to buy or sell any stock, and does not take account of your objectives, or your financial situation. We aim to bring you long-term focused analysis driven by fundamental data. Note that our analysis may not factor in the latest price-sensitive company announcements or qualitative material. Simply Wall St has no position in any stocks mentioned.
Have feedback on this article? Concerned about the content? Get in touch with us directly. Alternatively, email editorial-team@simplywallst.com