
- PREMIUM
- LIVE QUOTES
- INSTITUTIONS
 Index Options
 State Street
 CME Group
 Nasdaq
 Cboe
Cboe TradingView
 Wall Street Journal
Is It Too Late To Consider Bel Fuse After Its 967% Five Year Surge?
- If you have been wondering whether Bel Fuse is still good value after its huge run, you are not alone. This is one of those stocks where the price chart raises as many questions as it answers.
- Bel Fuse has climbed 4.1% over the last week, 15.0% over the past month, and an eye catching 70.4% year to date, with a staggering 333.4% gain over 3 years and 967.0% over 5 years reshaping how the market views its potential.
- Part of this momentum reflects growing attention on niche hardware and power management suppliers, where Bel Fuse has been winning contracts and expanding its product footprint with OEM customers, which naturally draws in growth focused investors. At the same time, the broader enthusiasm for industrial tech names tied to connectivity and power solutions has put a spotlight on companies like Bel that used to fly under the radar.
- Despite all that, Bel Fuse only scores a 2 out of 6 on our valuation checks, which might surprise anyone looking at the share price alone. Next we will dig into the main valuation approaches analysts use for this stock and then finish with a more holistic way to think about what it is really worth.
Bel Fuse scores just 2/6 on our valuation checks. See what other red flags we found in the full valuation breakdown.
Approach 1: Bel Fuse Discounted Cash Flow (DCF) Analysis
A Discounted Cash Flow, or DCF, model estimates what a company is worth by projecting the cash it can generate in the future and then discounting those cash flows back to today. For Bel Fuse, the model uses a 2 Stage Free Cash Flow to Equity approach based on cash flow projections.
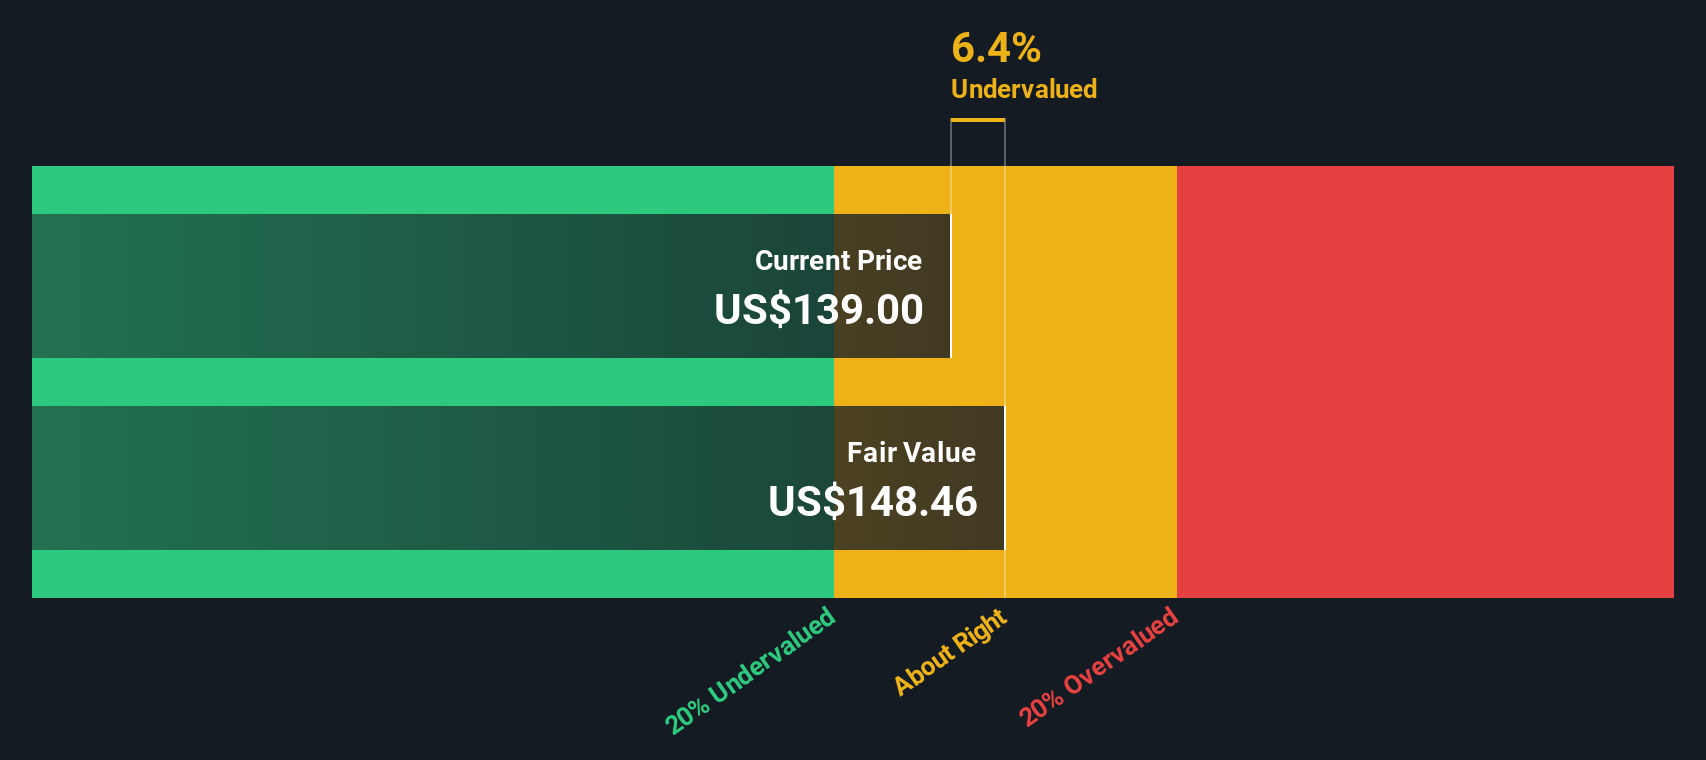
Bel Fuse currently generates about $46 million in free cash flow, and analysts expect this to grow meaningfully over time, with projections reaching around $150 million in ten years. Early years rely on direct analyst estimates, while Simply Wall St extrapolates the later years using gradually slowing growth assumptions to reflect a more mature business profile.
When these future cash flows are discounted back to today, the model arrives at an estimated intrinsic value of roughly $159.90 per share. Compared to the current share price, this suggests Bel Fuse may be about 5.5% undervalued. This is a modest margin rather than a deep value gap, but it is consistent with the recent share price strength.
Result: ABOUT RIGHT
Bel Fuse is fairly valued according to our Discounted Cash Flow (DCF), but this can change at a moment's notice. Track the value in your watchlist or portfolio and be alerted on when to act.
Approach 2: Bel Fuse Price vs Earnings
For a consistently profitable business like Bel Fuse, the price to earnings ratio is a straightforward way to see how much investors are willing to pay for each dollar of current earnings. In general, companies with stronger, more reliable growth and lower perceived risk justify a higher PE multiple, while slower growing or riskier names warrant a lower one.
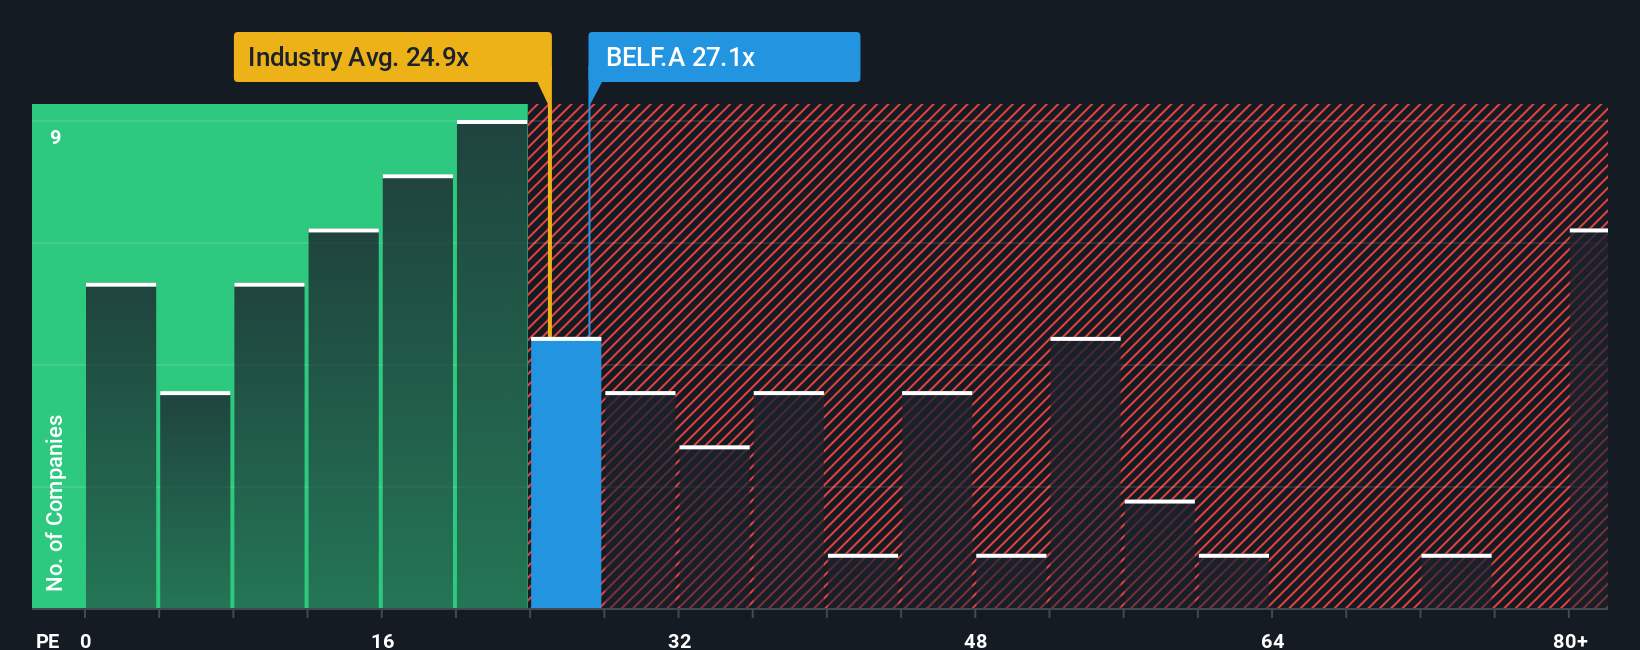
Bel Fuse currently trades at about 29.3x earnings, which is above the broader Electronic industry average of roughly 24.8x but still below the peer group average of around 38.2x. Simply Wall St also calculates a proprietary Fair Ratio of 22.8x for Bel Fuse, which reflects what its PE should be once you factor in its specific earnings growth outlook, profitability, industry positioning, market cap and risk profile. This Fair Ratio is more tailored than a simple comparison with peers or the industry, because it adjusts for the company’s own fundamentals rather than assuming all electronics stocks deserve the same multiple.
Since Bel Fuse’s actual PE of 29.3x sits meaningfully above the modelled Fair Ratio of 22.8x, the shares look somewhat stretched on an earnings multiple basis.
Result: OVERVALUED
PE ratios tell one story, but what if the real opportunity lies elsewhere? Discover 1448 companies where insiders are betting big on explosive growth.
Upgrade Your Decision Making: Choose your Bel Fuse Narrative
Earlier we mentioned that there is an even better way to understand valuation, so let us introduce you to Narratives: a simple way to turn your view of Bel Fuse into a structured story that connects your assumptions about future revenue, earnings and margins to a concrete fair value estimate. A Narrative is your personalised storyline for a company, where you spell out what you think will happen to its business, translate that into a financial forecast, and then see what price those assumptions imply the stock is really worth. Narratives on Simply Wall St, available to millions of investors via the Community page, make this easy by linking the company’s story to the numbers and then comparing your Fair Value to the current market price to help you decide whether to buy, hold or sell. They also update dynamically as new data, like earnings reports or major news, comes in so your view stays current without extra effort. For example, one Bel Fuse Narrative might see fair value at $110 on the back of resilient aerospace and AI growth, while a more cautious Narrative using weaker revenue and margin assumptions could land much lower, leading to very different decisions.
Do you think there's more to the story for Bel Fuse? Head over to our Community to see what others are saying!

This article by Simply Wall St is general in nature. We provide commentary based on historical data and analyst forecasts only using an unbiased methodology and our articles are not intended to be financial advice. It does not constitute a recommendation to buy or sell any stock, and does not take account of your objectives, or your financial situation. We aim to bring you long-term focused analysis driven by fundamental data. Note that our analysis may not factor in the latest price-sensitive company announcements or qualitative material. Simply Wall St has no position in any stocks mentioned.
Have feedback on this article? Concerned about the content? Get in touch with us directly. Alternatively, email editorial-team@simplywallst.com