
- PREMIUM
- LIVE QUOTES
- INSTITUTIONS
 Index Options
 State Street
 CME Group
 Nasdaq
 Cboe
Cboe TradingView
 Wall Street Journal
Is Atlanticus Still Attractive After 10% Weekly Jump and Strong Multi Year Gains?
- Wondering if Atlanticus Holdings at around $65.96 is still a smart buy, or if the big gains are already behind it? This breakdown will help you decide whether the current price makes sense or is quietly offering value.
- The stock has jumped 10.6% over the last week and 25.8% in the past month, adding to a hefty 184.9% gain over 3 years and 151.5% over 5 years, which naturally raises questions about how much upside is left versus the risk of a pullback.
- Recent attention around Atlanticus has focused on its role in consumer credit and financing partnerships, especially as investors reassess which lenders can still grow in a higher rate environment. That backdrop has helped shine a light on business models that generate fee based and interest income without taking on excessive balance sheet risk. Alongside renewed interest in specialty finance names, that context helps explain why the stock has been re rated after a relatively modest 9.2% return over the last year but strong multi year performance.
- On our framework Atlanticus scores a 4/6 valuation score, meaning it looks undervalued on most but not all of the key checks. In the sections ahead we will unpack what different valuation methods say about the stock, before finishing with a more holistic way to judge whether the current price truly reflects the full story.
Find out why Atlanticus Holdings's 9.2% return over the last year is lagging behind its peers.
Approach 1: Atlanticus Holdings Excess Returns Analysis
The Excess Returns model looks at how much profit Atlanticus generates above the minimum return that shareholders require on their equity. Instead of focusing on short term earnings swings, it evaluates whether the company consistently creates value on the capital it has invested.
For Atlanticus, the model starts with a Book Value of $38.96 per share and a Stable EPS of $8.38 per share, based on the median return on equity from the past 5 years. With a Cost of Equity of $5.27 per share, the company is estimated to produce an Excess Return of $3.11 per share. That is underpinned by an Average Return on Equity of 19.89% and a Stable Book Value assumption of $42.13 per share, derived from weighted future book value estimates from two analysts.
Translating these excess returns into an intrinsic value, the model arrives at an estimated fair value of about $75.82 per share, implying the stock is roughly 13.0% undervalued versus the current price around $65.96.
Result: UNDERVALUED
Our Excess Returns analysis suggests Atlanticus Holdings is undervalued by 13.0%. Track this in your watchlist or portfolio, or discover 907 more undervalued stocks based on cash flows.

Approach 2: Atlanticus Holdings Price vs Earnings
For a consistently profitable lender like Atlanticus, the price to earnings multiple is a natural way to gauge value because it links what investors pay directly to the company earnings they receive today. In general, higher expected growth and lower perceived risk justify a richer PE ratio, while slower growth or more volatile earnings usually demand a discount.
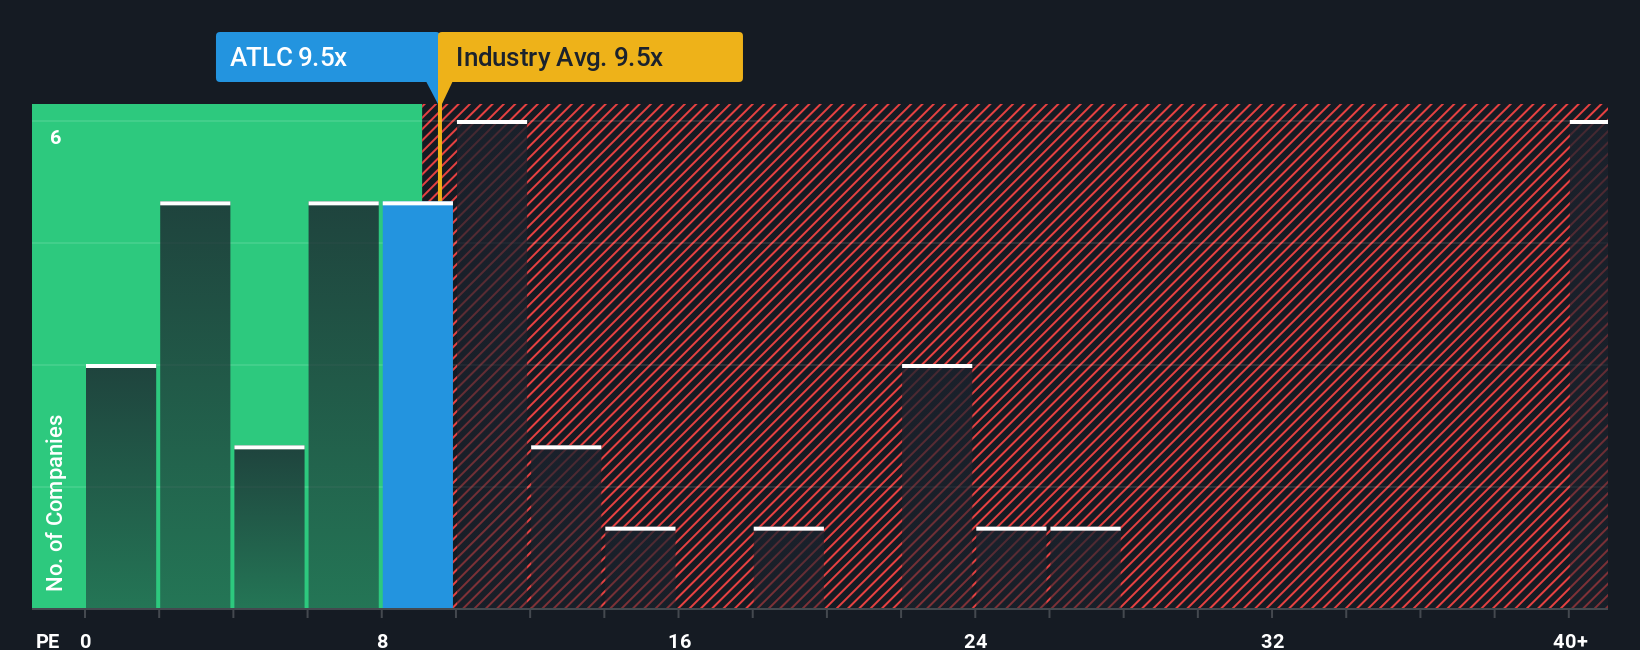
Atlanticus currently trades on a PE of about 9.49x, which is roughly in line with the broader Consumer Finance industry average of 9.49x, but well below the peer group average of around 37.72x. Simply Wall St also calculates a Fair Ratio of 19.85x, a proprietary estimate of what a reasonable PE might be once factors like earnings growth, profitability, industry dynamics, size and specific risks are all considered together.
This Fair Ratio framework is more informative than a simple comparison with peers or the sector because it adjusts for company specific strengths and risks rather than assuming all lenders deserve the same multiple. When set against this 19.85x Fair Ratio, Atlanticus 9.49x PE suggests the market is still pricing the stock at a notable discount to what its fundamentals arguably warrant.
Result: UNDERVALUED
PE ratios tell one story, but what if the real opportunity lies elsewhere? Discover 1448 companies where insiders are betting big on explosive growth.
Upgrade Your Decision Making: Choose your Atlanticus Holdings Narrative
Earlier we mentioned that there is an even better way to understand valuation, so let us introduce you to Narratives, a simple way to connect your view of Atlanticus with the numbers behind its potential. A Narrative is your story about a company expressed through your assumptions about its future revenue, earnings and margins, which then flow into a financial forecast and an estimated fair value. Instead of stopping at a PE multiple or model output, Narratives help you see how the company journey you believe in translates into cash flows and a price that feels reasonable. On Simply Wall St, Narratives are easy to create and compare within the Community page, where millions of investors share how their forecasts stack up against the current share price. They also update dynamically as fresh information arrives, so changes in news or earnings automatically feed back into the numbers. For Atlanticus, one investor might build a Narrative with strong growth and high margins that justifies a fair value well above today price, while another might assume slower growth and a higher discount rate that points to a fair value comfortably below the current market level.
Do you think there's more to the story for Atlanticus Holdings? Head over to our Community to see what others are saying!

This article by Simply Wall St is general in nature. We provide commentary based on historical data and analyst forecasts only using an unbiased methodology and our articles are not intended to be financial advice. It does not constitute a recommendation to buy or sell any stock, and does not take account of your objectives, or your financial situation. We aim to bring you long-term focused analysis driven by fundamental data. Note that our analysis may not factor in the latest price-sensitive company announcements or qualitative material. Simply Wall St has no position in any stocks mentioned.
Have feedback on this article? Concerned about the content? Get in touch with us directly. Alternatively, email editorial-team@simplywallst.com