
- PREMIUM
- LIVE QUOTES
- INSTITUTIONS
 Index Options
 State Street
 CME Group
 Nasdaq
 Cboe
Cboe TradingView
 Wall Street Journal
Is Teleflex Now Attractively Priced After Recent Share Rebound And Portfolio Refocus?
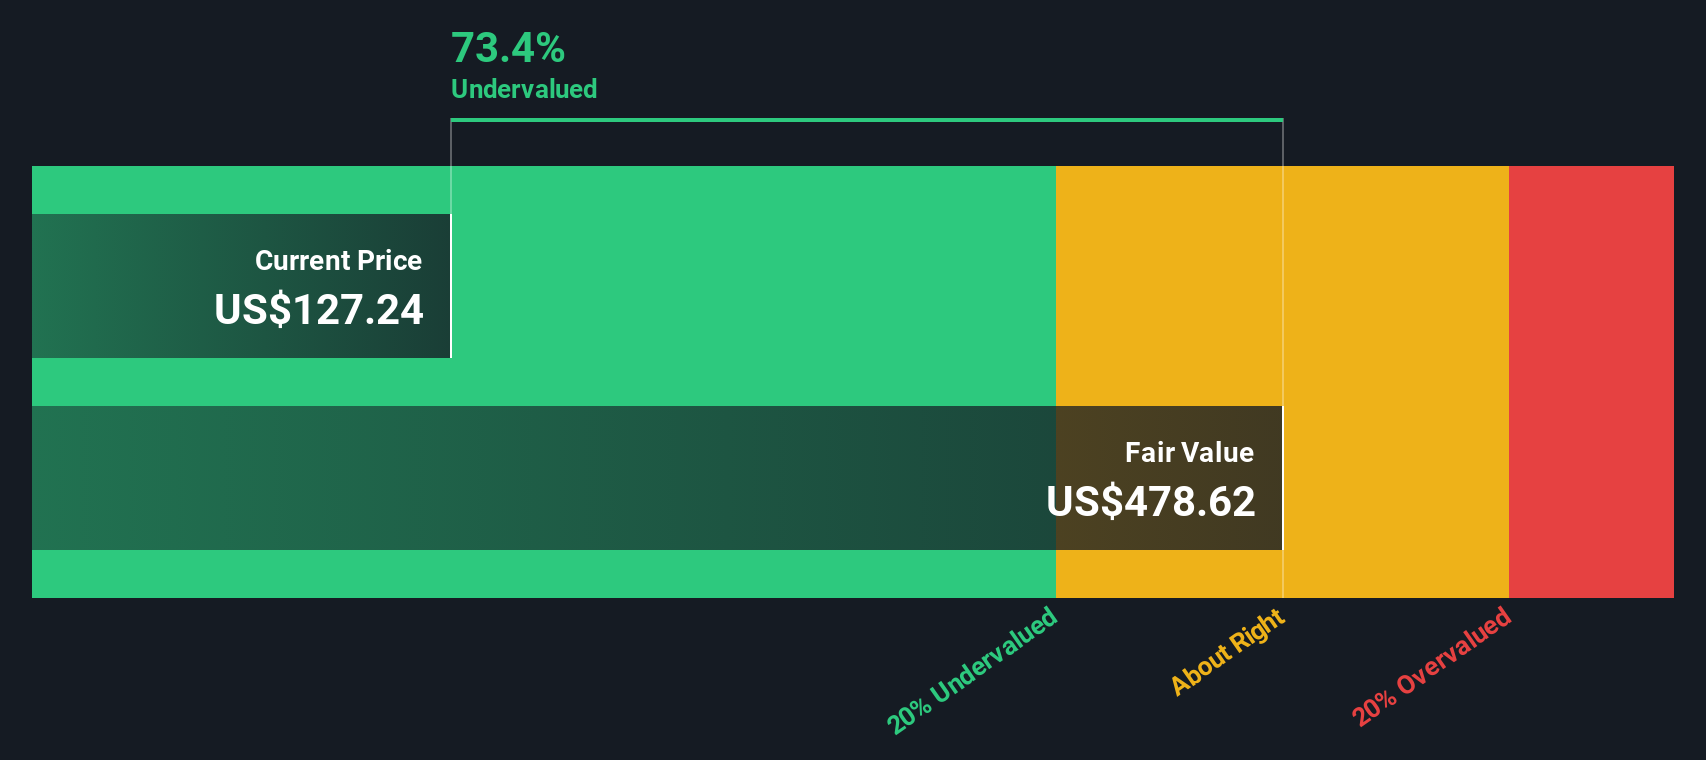
- If you are wondering whether Teleflex at around $126 is a bargain or a value trap, you are not alone. This article is going to unpack exactly what the market might be missing.
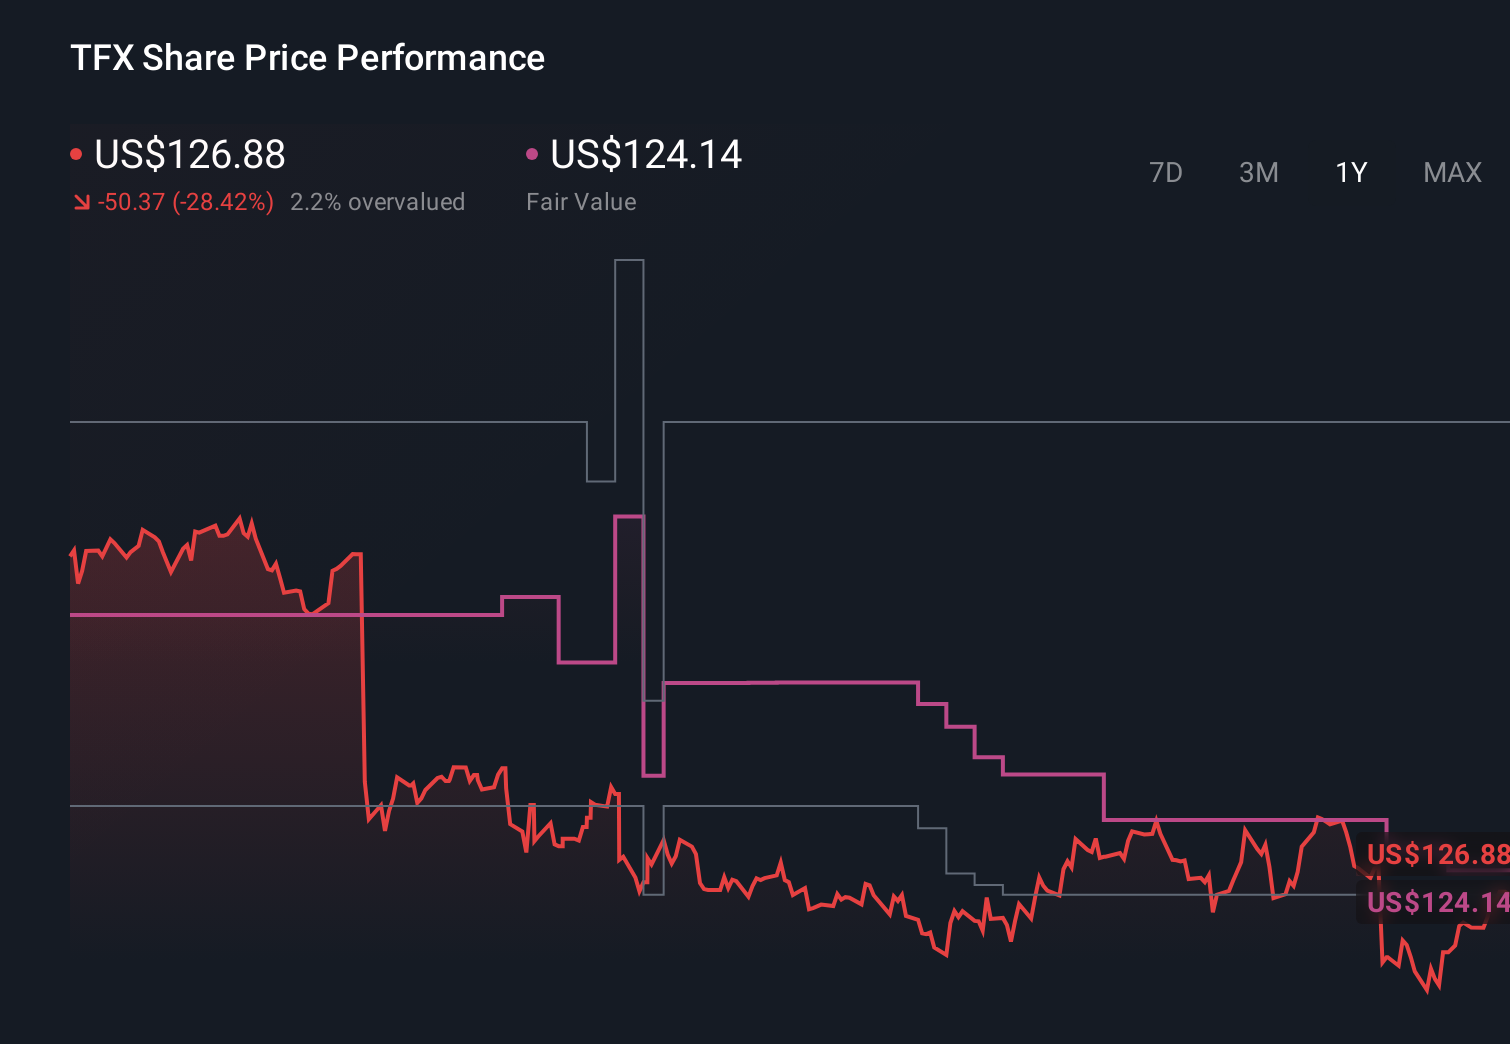
- The stock has bounced 5.3% over the last week and 13.8% over the last month, even though it is still down 29.1% year to date and 28.8% over the past year. This pattern often signals that investors are rethinking the balance between risk and reward.
- Recent coverage has focused on Teleflex sharpening its portfolio around higher margin medical devices and doubling down on core procedural solutions. These moves can shift how investors view its long term growth runway and pricing power. At the same time, the broader healthcare space has been repricing as investors rotate between defensive names and higher growth stories, which helps explain some of the volatility in Teleflex shares.
- On our framework, Teleflex scores a 3/6 valuation check, suggesting some areas of potential undervaluation but not an outright deep value case. Next we will look at what the main valuation approaches indicate, before finishing with a more intuitive way to think about what the stock might be worth.
Find out why Teleflex's -28.8% return over the last year is lagging behind its peers.
Approach 1: Teleflex Discounted Cash Flow (DCF) Analysis
A Discounted Cash Flow model projects the cash a business is expected to generate in the future and then discounts those cash flows back to today, aiming to estimate what the company is intrinsically worth in $.
Teleflex currently generates about $273.1 Million in free cash flow, and the 2 Stage Free Cash Flow to Equity model uses this as a starting point. Analysts provide detailed forecasts for the next few years, including an estimate of $115.6 Million in free cash flow for 2026. Simply Wall St then extrapolates this path out to 2035, where projected annual free cash flow is around $37.4 Million. All of these future cash flows are discounted to reflect risk and the time value of money.
On this basis, the DCF model arrives at an intrinsic value of roughly $15.04 per share. Compared with the current share price around $126, the stock screens as roughly 743.8% overvalued according to this framework.
Result: OVERVALUED
Our Discounted Cash Flow (DCF) analysis suggests Teleflex may be overvalued by 743.8%. Discover 907 undervalued stocks or create your own screener to find better value opportunities.
Approach 2: Teleflex Price vs Sales
For companies that are consistently generating revenue in a relatively steady industry like medical equipment, the price to sales ratio is a useful valuation tool because it focuses on what investors are paying for each dollar of sales, regardless of short term accounting noise in earnings.
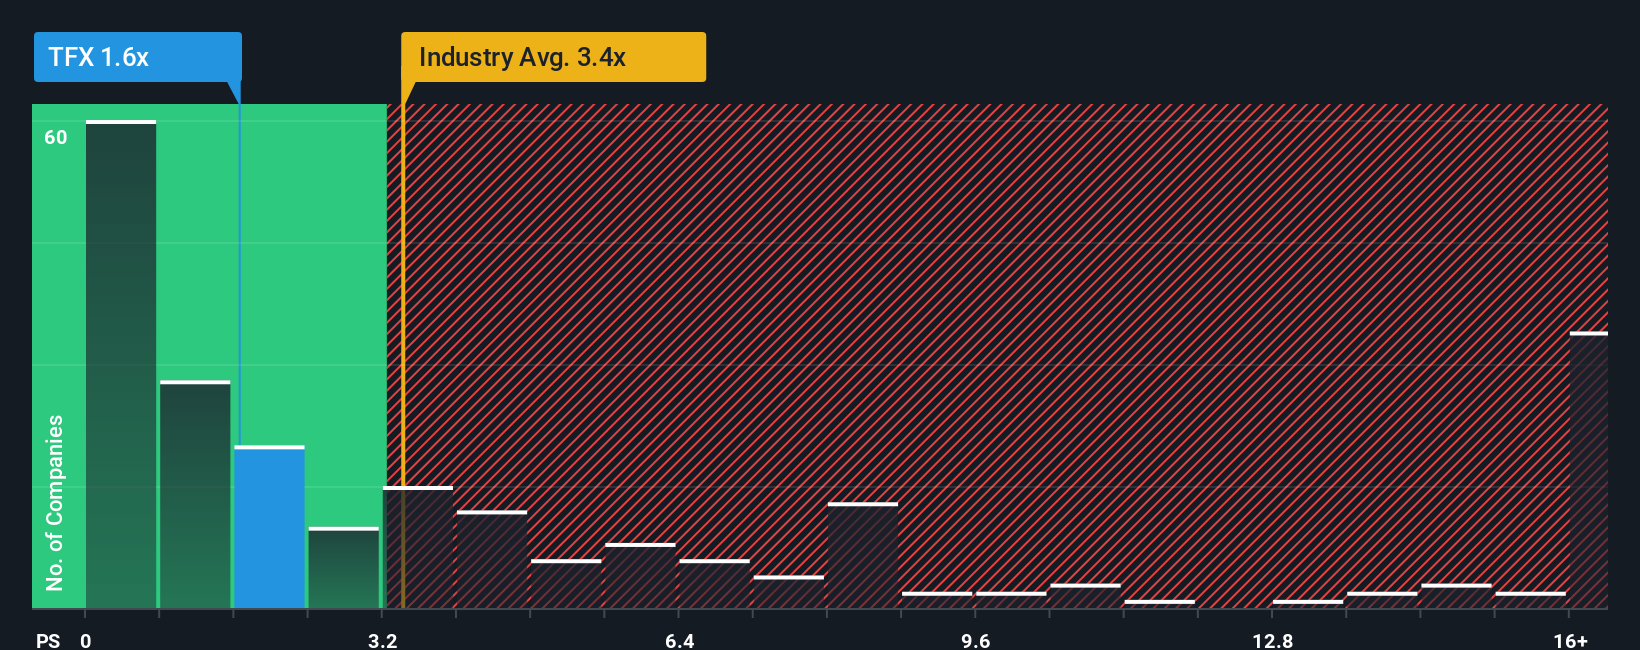
In general, businesses with stronger growth prospects and lower perceived risk can justify a higher sales multiple, while slower growing or riskier companies usually deserve a lower one. Teleflex currently trades on a price to sales ratio of about 1.76x, which is below both the Medical Equipment industry average of roughly 3.46x and the broader peer group average around 6.75x.
Simply Wall St also calculates a Fair Ratio of 2.21x, a proprietary estimate of the price to sales multiple Teleflex should trade on after adjusting for its specific growth outlook, profitability, risk profile, industry positioning and market cap. This can be more informative than a simple comparison with peers or the sector because those comparisons can be distorted by outliers or very different business models. Since Teleflex’s actual 1.76x multiple sits meaningfully below the 2.21x Fair Ratio, the shares appear to be undervalued on this framework.
Result: UNDERVALUED
PS ratios tell one story, but what if the real opportunity lies elsewhere? Discover 1448 companies where insiders are betting big on explosive growth.
Upgrade Your Decision Making: Choose your Teleflex Narrative
Earlier we mentioned that there is an even better way to understand valuation, so let us introduce you to Narratives, a simple approach where you describe your story about Teleflex, set your own expectations for future revenue, earnings and margins, and see how that story flows through to a financial forecast and then to a Fair Value that you can compare against today’s price. Narratives are available on Simply Wall St’s Community page, where millions of investors share and refine their views, and they are updated dynamically as new information like earnings, guidance changes or trial results comes in, so your Fair Value view evolves with the facts. For example, one Teleflex Narrative might lean bullish, assuming successful integration of BIOTRONIK, sustained high single digit revenue growth and stronger margins to support a Fair Value above $150. A more cautious Narrative might focus on goodwill impairments, reimbursement pressure and slower growth to justify a Fair Value closer to $120, giving you a clear, structured way to see how different perspectives translate into different valuations.
Do you think there's more to the story for Teleflex? Head over to our Community to see what others are saying!
This article by Simply Wall St is general in nature. We provide commentary based on historical data and analyst forecasts only using an unbiased methodology and our articles are not intended to be financial advice. It does not constitute a recommendation to buy or sell any stock, and does not take account of your objectives, or your financial situation. We aim to bring you long-term focused analysis driven by fundamental data. Note that our analysis may not factor in the latest price-sensitive company announcements or qualitative material. Simply Wall St has no position in any stocks mentioned.
Have feedback on this article? Concerned about the content? Get in touch with us directly. Alternatively, email editorial-team@simplywallst.com