
- PREMIUM
- LIVE QUOTES
- INSTITUTIONS
 Index Options
 State Street
 CME Group
 Nasdaq
 Cboe
Cboe TradingView
 Wall Street Journal
Is Kinder Morgan Still Attractive After Recent Pullback Despite Strong Multi Year Share Gains
- If you are wondering whether Kinder Morgan is still attractively priced today or if most of the upside is already reflected in the share price, this article will walk through what the numbers indicate about its current valuation.
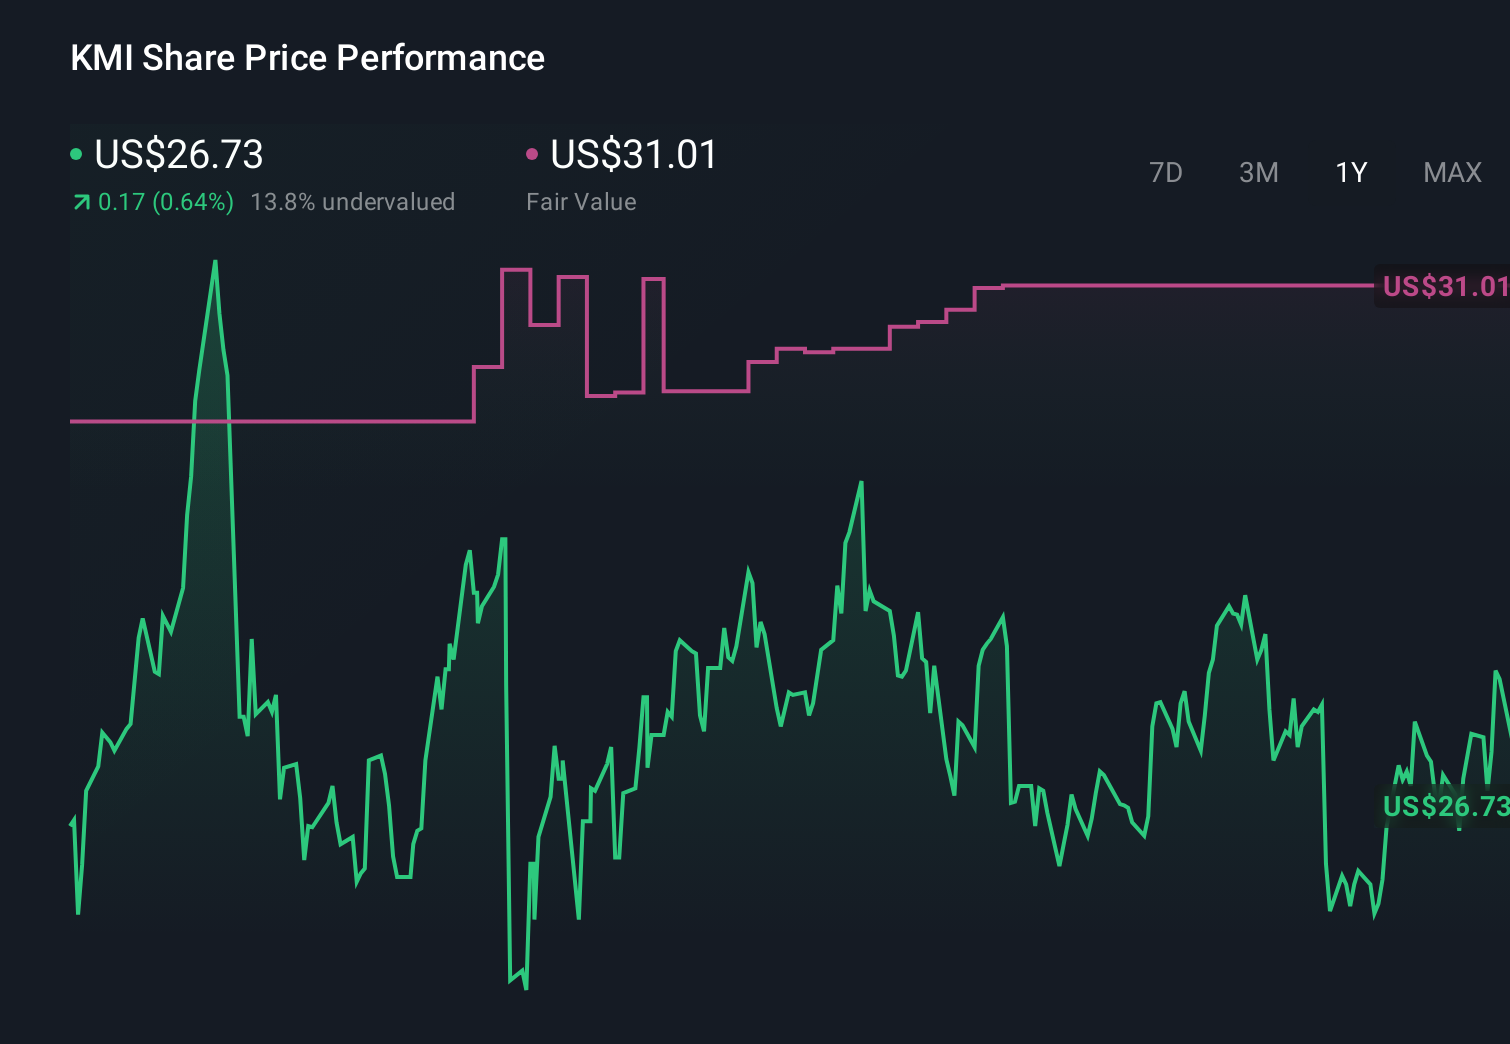
- The stock has pulled back recently, with shares down around 3.7% over the last week and 1.0% over the past month, but longer-term holders are still sitting on gains of 78.2% over 3 years and 151.6% over 5 years.
- Recent moves have been influenced by ongoing debates around U.S. natural gas demand, new pipeline and terminal projects, and regulatory changes that affect long-term infrastructure returns. Investors are also weighing Kinder Morgan’s capital allocation decisions, including buybacks versus new growth investments, which can affect how the market prices its future cash flows.
- Right now Kinder Morgan scores a 2/6 on our valuation checks. This suggests it appears undervalued on a couple of measures but not across the board. Next we will unpack what different valuation approaches indicate, then finish with an approach that can be a more powerful way to think about its long-term value.
Kinder Morgan scores just 2/6 on our valuation checks. See what other red flags we found in the full valuation breakdown.
Approach 1: Kinder Morgan Discounted Cash Flow (DCF) Analysis
A Discounted Cash Flow, or DCF, model estimates what a company is worth by projecting the cash it can generate in the future and then discounting those cash flows back to today to reflect risk and the time value of money.
For Kinder Morgan, the model starts with last twelve month Free Cash Flow of about $2.4 billion and uses analyst forecasts plus longer term extrapolations to map how this could grow. Analyst estimates and extensions suggest Free Cash Flow could reach just under $6.0 billion by 2035, with intermediate projections such as around $4.2 billion by 2029. Simply Wall St applies a 2 Stage Free Cash Flow to Equity framework, where near term analyst numbers are followed by gradually slowing, model based growth assumptions.
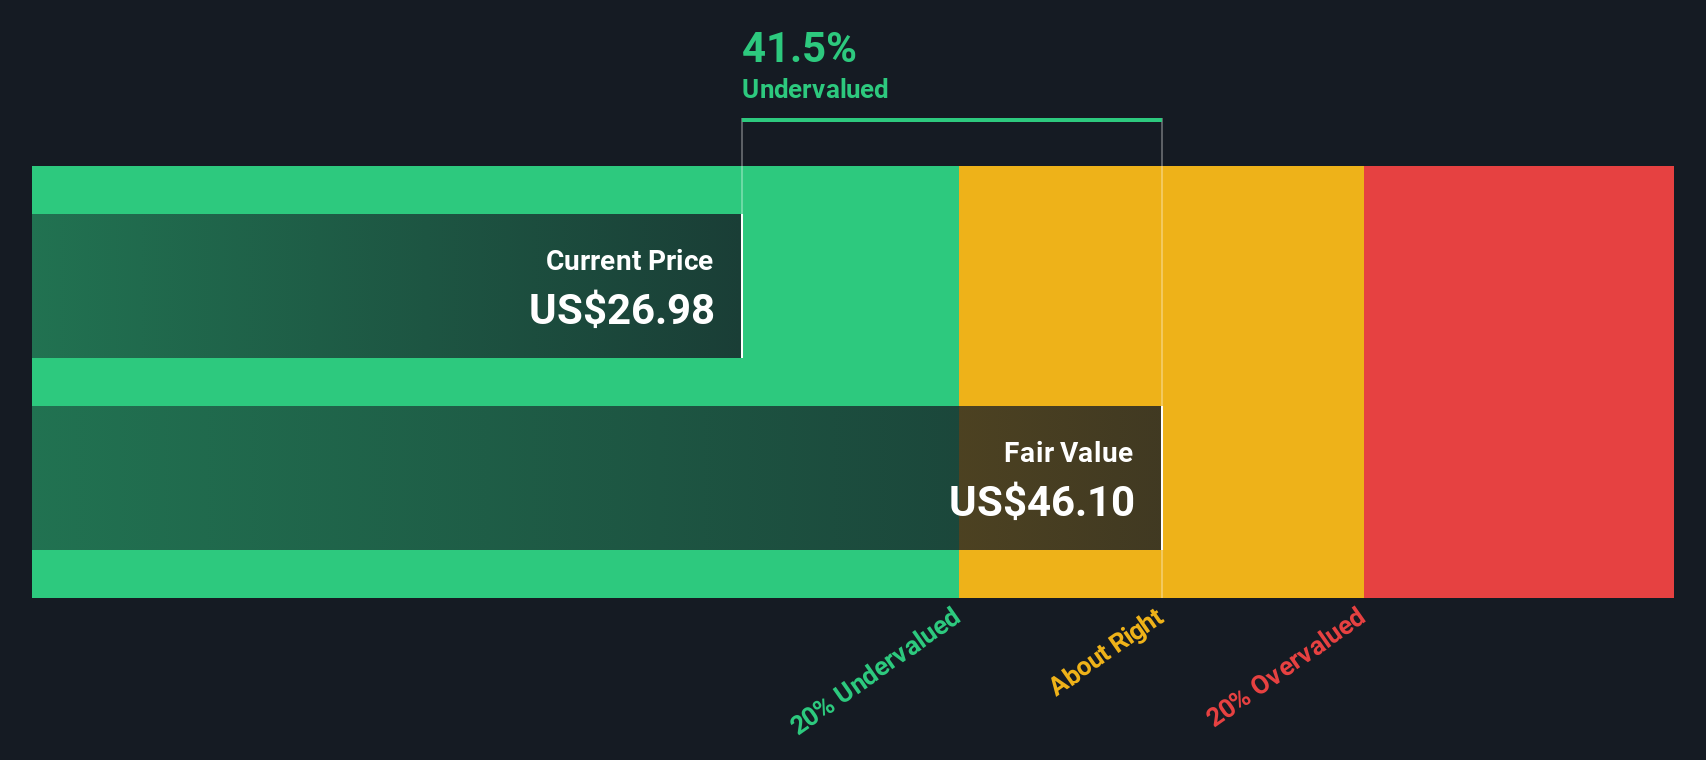
When all those future cash flows are discounted back into today’s dollars, the DCF model arrives at an intrinsic value of roughly $49.19 per share. Compared with the current share price, this indicates Kinder Morgan is about 45.7% undervalued, which means the market is applying a sizable discount to its projected cash generation.
Result: UNDERVALUED
Our Discounted Cash Flow (DCF) analysis suggests Kinder Morgan is undervalued by 45.7%. Track this in your watchlist or portfolio, or discover 907 more undervalued stocks based on cash flows.
Approach 2: Kinder Morgan Price vs Earnings
For profitable companies like Kinder Morgan, the price to earnings, or PE, ratio is a useful way to judge valuation because it ties the share price directly to the profits that shareholders ultimately rely on. A higher PE can be justified when investors expect stronger growth or see the business as relatively low risk, while slower growth or greater uncertainty usually warrants a lower, more conservative multiple.
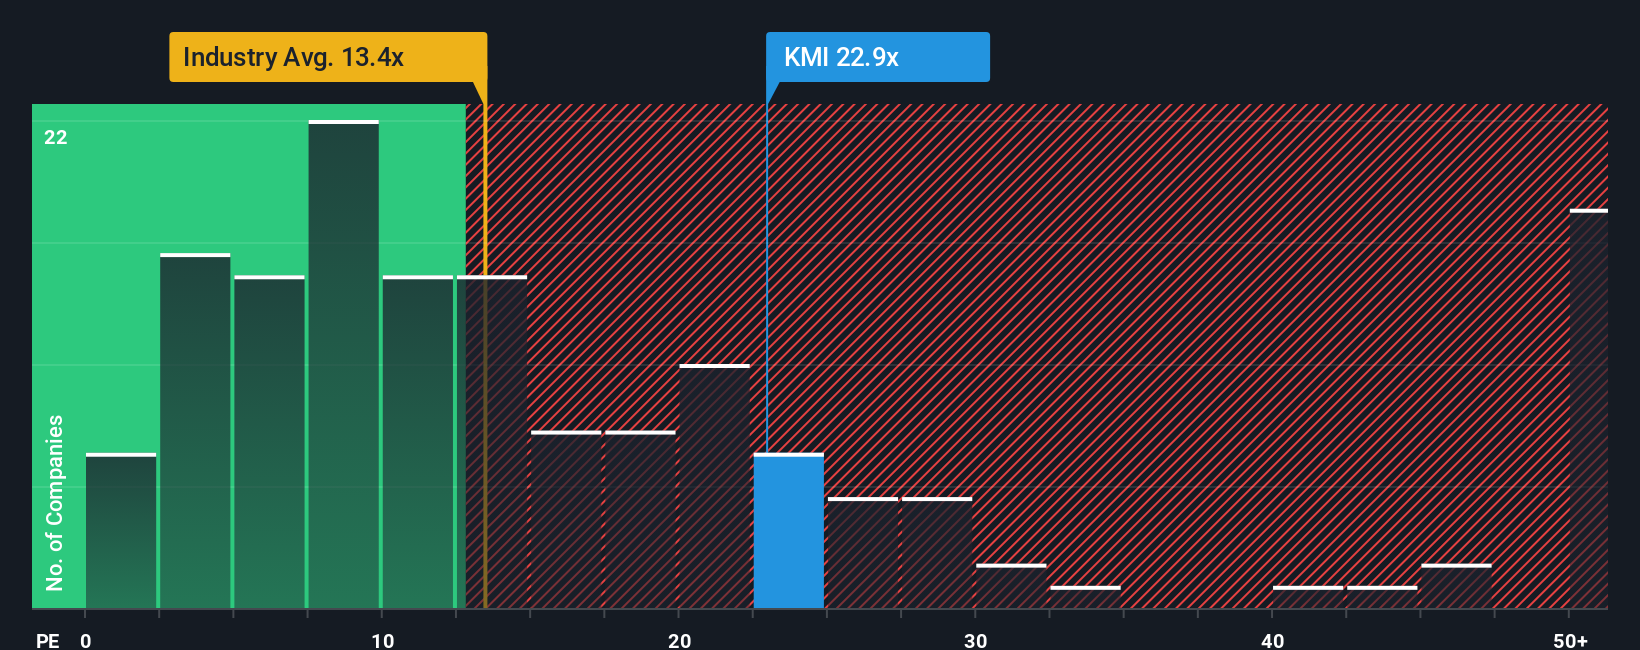
Kinder Morgan currently trades on a PE of about 21.9x, which sits well above the broader Oil and Gas industry average of around 13.3x and also above the peer group average of roughly 16.9x. Simply Wall St’s Fair Ratio framework estimates a more appropriate PE for Kinder Morgan of about 21.1x, based on its earnings growth outlook, industry position, profit margins, market cap and specific risk profile. This tailored Fair Ratio is more informative than a simple comparison with peers or the sector, because it adjusts for Kinder Morgan’s own fundamentals rather than assuming all companies should trade on the same benchmark.
Comparing the current PE of 21.9x to the Fair Ratio of 21.1x suggests Kinder Morgan is trading slightly above its modeled fair value, pointing to a modest premium.
Result: OVERVALUED
PE ratios tell one story, but what if the real opportunity lies elsewhere? Discover 1448 companies where insiders are betting big on explosive growth.
Upgrade Your Decision Making: Choose your Kinder Morgan Narrative
Earlier we mentioned that there is an even better way to understand valuation, so let us introduce you to Narratives. Narratives turn your view of Kinder Morgan’s future into a clear story that links business drivers, forecasts, and a fair value estimate.
A Narrative is simply your structured perspective on the company, where you spell out how trends in natural gas demand, regulation, contracts, and competition could shape Kinder Morgan’s future revenue, earnings, and margins, and then translate that story into financial forecasts.
On Simply Wall St’s Community page, investors use Narratives as an easy, accessible tool to connect a company’s story to a fair value, then compare that fair value to the current share price to decide whether it looks like a buy, hold, or sell at a given time.
Because Narratives are updated dynamically as new information arrives, such as earnings reports or major LNG export news, your Kinder Morgan thesis and its fair value estimate can evolve in real time as the facts change.
For example, one investor might see robust LNG growth and assign Kinder Morgan a fair value closer to $38.00, while a more cautious investor focused on leverage and transition risks might land nearer $24.00. This could lead to very different buy or sell decisions at today’s price.
Do you think there's more to the story for Kinder Morgan? Head over to our Community to see what others are saying!
This article by Simply Wall St is general in nature. We provide commentary based on historical data and analyst forecasts only using an unbiased methodology and our articles are not intended to be financial advice. It does not constitute a recommendation to buy or sell any stock, and does not take account of your objectives, or your financial situation. We aim to bring you long-term focused analysis driven by fundamental data. Note that our analysis may not factor in the latest price-sensitive company announcements or qualitative material. Simply Wall St has no position in any stocks mentioned.
Have feedback on this article? Concerned about the content? Get in touch with us directly. Alternatively, email editorial-team@simplywallst.com