
- PREMIUM
- LIVE QUOTES
- INSTITUTIONS
 Index Options
 State Street
 CME Group
 Nasdaq
 Cboe
Cboe TradingView
 Wall Street Journal
Is Victoria's Secret Stock Price Rally Justified After Recent Double Digit Gains?
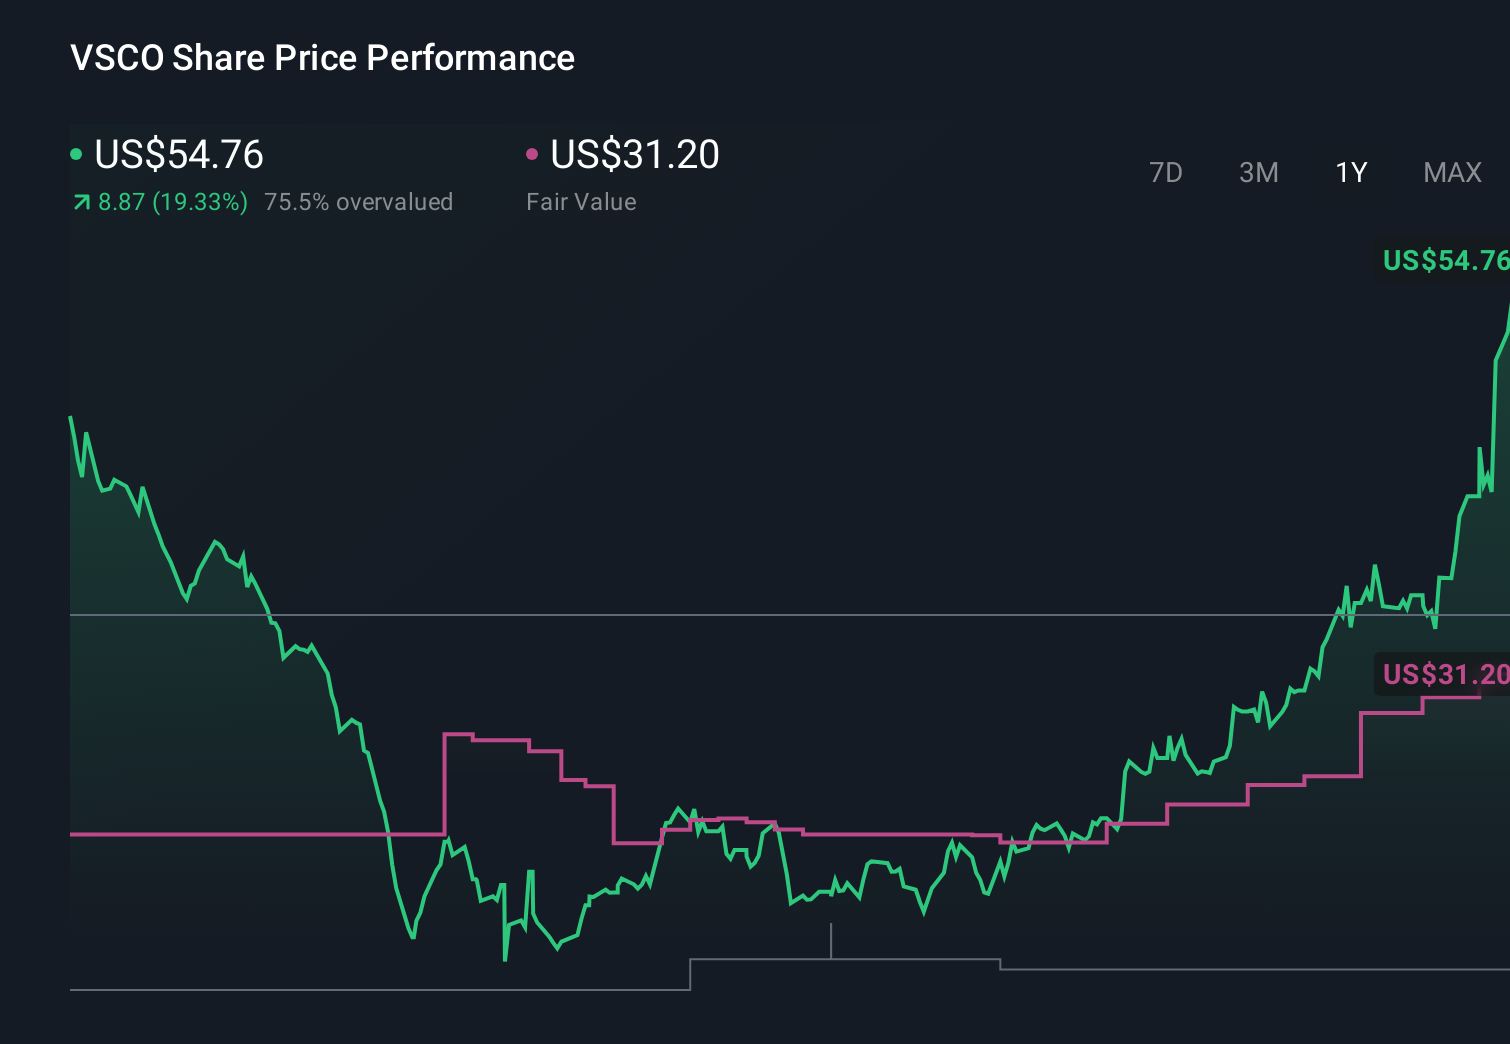
- Wondering if Victoria's Secret at around $54 a share is a comeback story worth paying up for, or a brand trading ahead of its true value? This breakdown is designed to help you answer that.
- After climbing 11.1% over the last week, 54.0% over the past month, and 34.8% year to date, the stock is now up 11.9% over the last year and 42.4% over three years. This naturally raises the question of whether the market is getting ahead of itself.
- Investors have been reacting to a mix of headline themes, including ongoing brand repositioning, cost discipline, and renewed focus on direct to consumer channels. All of these feed into expectations for more sustainable growth. At the same time, broader retail sentiment has improved as investors rotate into consumer names that could benefit from steady discretionary spending rather than pure high growth stories.
- Even after this rally, Victoria's Secret only scores a 2/6 valuation check, suggesting some metrics flag it as undervalued while others point to potential overheating. We will walk through different valuation lenses next and then finish with a more nuanced way to think about what the market might really be pricing in.
Victoria's Secret scores just 2/6 on our valuation checks. See what other red flags we found in the full valuation breakdown.
Approach 1: Victoria's Secret Discounted Cash Flow (DCF) Analysis
A Discounted Cash Flow model estimates what a business is worth by projecting the cash it can generate in the future and then discounting those cash flows back into today’s dollars.
For Victoria's Secret, the latest twelve month Free Cash Flow is about $282.9 million, and analysts expect this to rise to roughly $406 million by 2028. Beyond the next few years, Simply Wall St extends these analyst forecasts, gradually tapering growth so that Free Cash Flow climbs toward the mid $600 million range by 2035. All of these projected cash flows, in $, are then discounted back using a 2 stage Free Cash Flow to Equity approach to reflect risk and the time value of money.
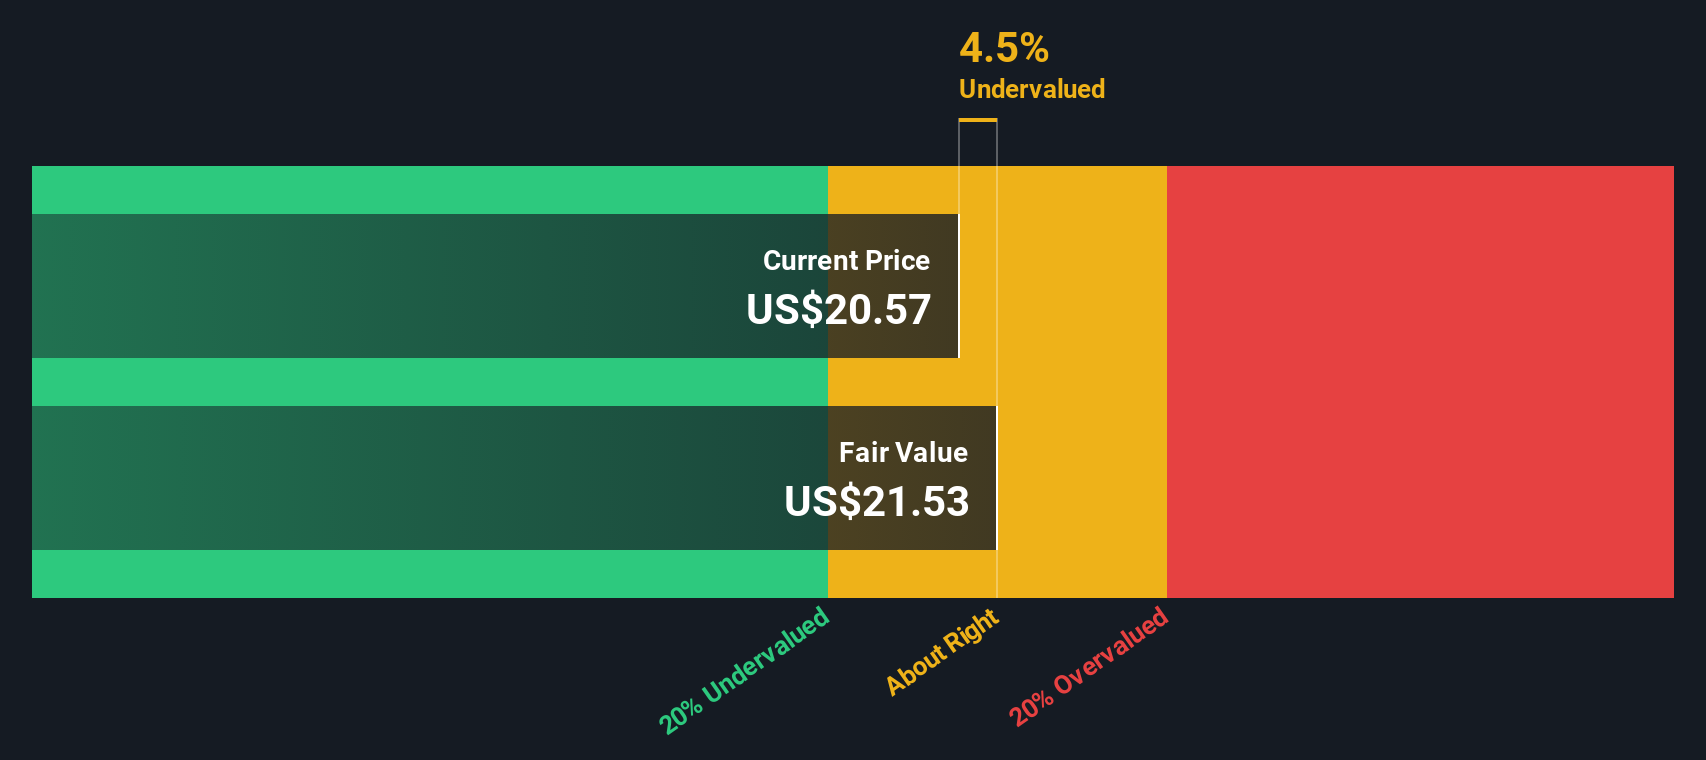
This model produces an estimated intrinsic value of about $76.67 per share, implying the stock is trading at roughly a 28.9% discount to its calculated fair value at around $54. On this basis, the market does not appear to be overpaying for the current cash flow outlook; it is applying a noticeable safety cushion.
Result: UNDERVALUED
Our Discounted Cash Flow (DCF) analysis suggests Victoria's Secret is undervalued by 28.9%. Track this in your watchlist or portfolio, or discover 907 more undervalued stocks based on cash flows.
Approach 2: Victoria's Secret Price vs Earnings
For profitable companies like Victoria's Secret, the price to earnings ratio is a useful shorthand for how much investors are willing to pay today for each dollar of current earnings. It naturally reflects both what the business is delivering now and what the market thinks it can deliver in the future.
In general, faster and more reliable earnings growth tends to justify a higher PE ratio, while cyclicality, leverage, or business risk usually pull that multiple down. Victoria's Secret currently trades on about 25.7x earnings, which is noticeably above the Specialty Retail industry average of roughly 20.3x and also ahead of the peer group average of about 20.3x. On a simple comparison, the stock looks expensive versus its sector.
Simply Wall St's Fair Ratio framework goes a step further by estimating what PE multiple would be reasonable once you factor in Victoria's Secret's earnings growth outlook, margins, risk profile, size, and its specific industry. That Fair Ratio comes out at around 22.1x, which is lower than the current 25.7x. Because this proprietary measure is tailored to the company rather than broad peer sets, it offers a more nuanced benchmark and suggests the market is now paying a premium to what fundamentals alone would justify.
Result: OVERVALUED

PE ratios tell one story, but what if the real opportunity lies elsewhere? Discover 1448 companies where insiders are betting big on explosive growth.
Upgrade Your Decision Making: Choose your Victoria's Secret Narrative
Earlier we mentioned that there is an even better way to understand valuation, so let us introduce you to Narratives, a simple way to attach your own story about a company to the numbers behind its fair value, future revenue, earnings, and margins.
A Narrative connects what you believe about a business, such as where it can grow, how its margins might evolve, and which risks matter most, to a concrete financial forecast and then to an explicit fair value estimate you can compare with today’s share price.
On Simply Wall St’s Community page, Narratives are an easy to use tool that millions of investors access to turn a high level view of a company into a structured projection that updates dynamically as new information like earnings, news, or guidance is released.
For Victoria's Secret, for example, one Narrative might reflect a bullish view that brand momentum, international expansion, and omnichannel execution support a fair value closer to the high analyst target of about $27. A more cautious Narrative might emphasize tariff headwinds, competitive pressure, and margin risks, leading to a fair value nearer the low target of roughly $17. This can help you decide whether the current price offers enough upside or signals it is time to trim.
Do you think there's more to the story for Victoria's Secret? Head over to our Community to see what others are saying!
This article by Simply Wall St is general in nature. We provide commentary based on historical data and analyst forecasts only using an unbiased methodology and our articles are not intended to be financial advice. It does not constitute a recommendation to buy or sell any stock, and does not take account of your objectives, or your financial situation. We aim to bring you long-term focused analysis driven by fundamental data. Note that our analysis may not factor in the latest price-sensitive company announcements or qualitative material. Simply Wall St has no position in any stocks mentioned.
Have feedback on this article? Concerned about the content? Get in touch with us directly. Alternatively, email editorial-team@simplywallst.com