
- PREMIUM
- LIVE QUOTES
- INSTITUTIONS
 Index Options
 State Street
 CME Group
 Nasdaq
 Cboe
Cboe TradingView
 Wall Street Journal
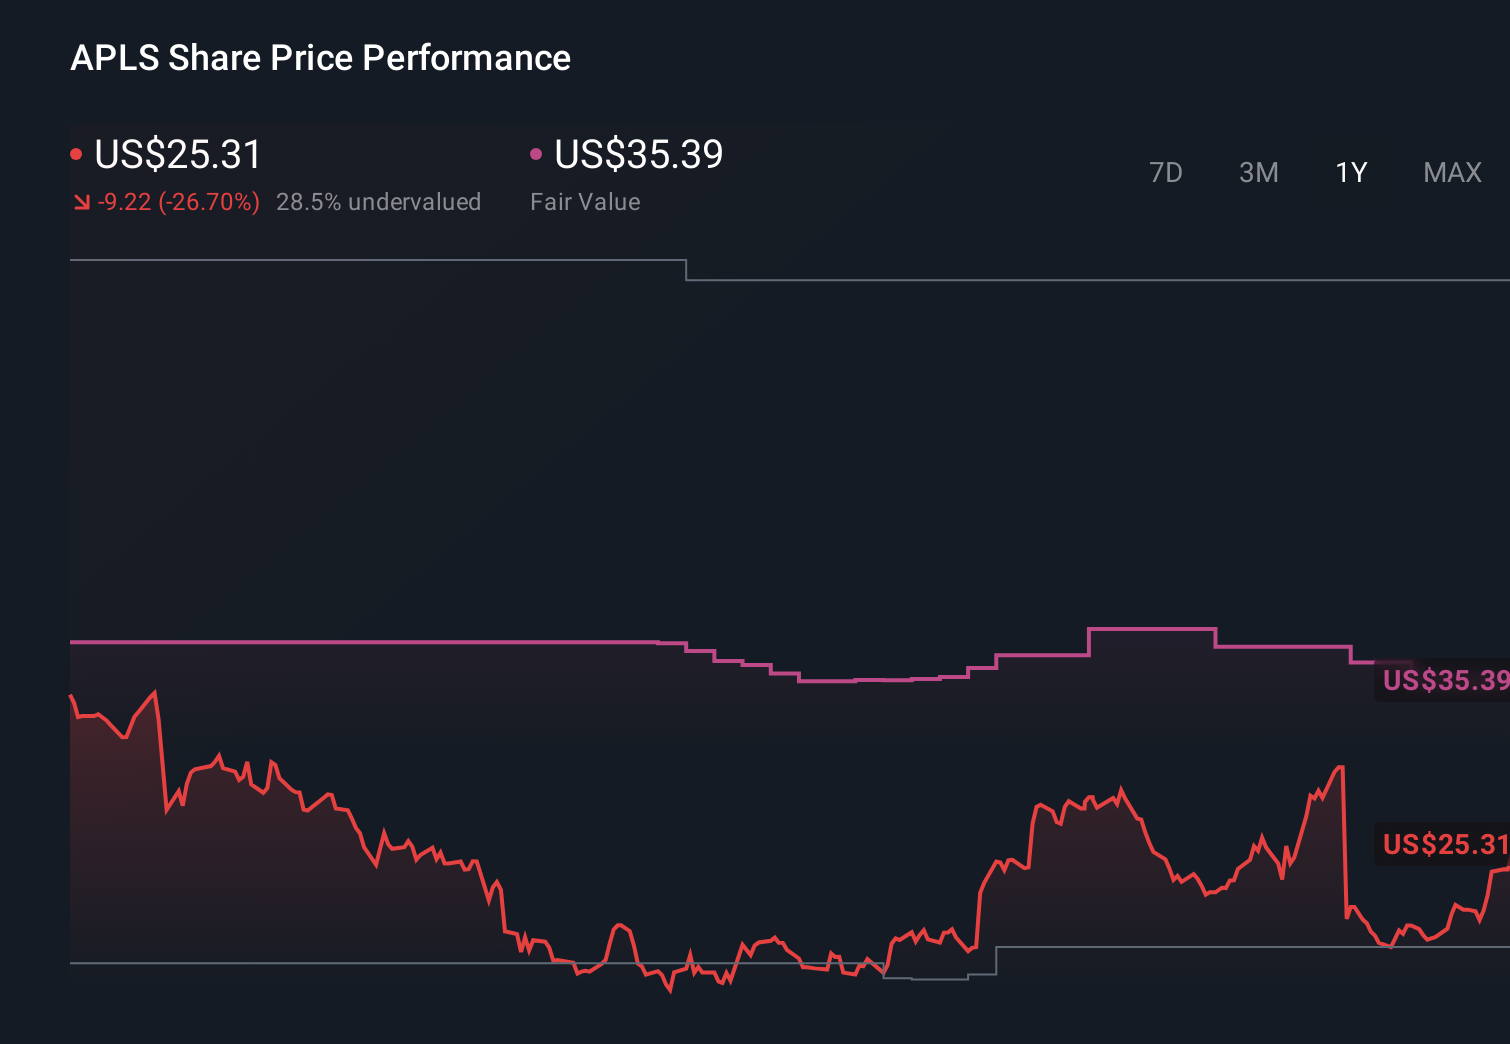
Is Apellis Pharmaceuticals Attractive After Recent 26% Surge Despite Mixed Valuation Signals?
- Wondering if Apellis Pharmaceuticals is finally offering real value at today’s price, or if it is just another biotech value trap in disguise, you are not alone.
- The stock has jumped 6.8% over the last week and 26.0% over the past month, even though it is still down 23.9% year to date and 24.0% over the past year. This tells you sentiment has started to shift, but long-term holders may still be underwater.
- That recent surge has been driven largely by improving confidence in the commercial trajectory of its complement-inhibition therapies and growing interest from investors looking for beaten down biotech names with real products rather than just pipelines. At the same time, debates around safety profiles, competitive threats and the durability of demand have kept a lid on how far and how fast the market is willing to re-rate the shares.
- On our framework, Apellis scores a modest 2 out of 6 on valuation checks, suggesting some pockets of undervaluation but not across the board. Next, we will unpack what different valuation methods are saying about the stock today and circle back at the end to a more holistic way of thinking about what Apellis might really be worth.
Apellis Pharmaceuticals scores just 2/6 on our valuation checks. See what other red flags we found in the full valuation breakdown.
Approach 1: Apellis Pharmaceuticals Discounted Cash Flow (DCF) Analysis
A Discounted Cash Flow model estimates what a business is worth today by projecting its future cash flows and discounting them back to the present. For Apellis Pharmaceuticals, this approach is based on a 2 Stage Free Cash Flow to Equity model using cash flow projections in $.
The company’s latest twelve month free cash flow is about $77.7 Million. Analyst forecasts, supplemented by Simply Wall St extrapolations, see free cash flow rising sharply over the next decade, from just $3.8 Million in 2026 to roughly $700.9 Million by 2035, as its therapies scale and profitability improves.
When these projected cash flows are discounted back, the model produces an intrinsic value of about $87.09 per share. Compared to the current share price, this implies the stock is trading at a 71.0% discount to its estimated fair value. This suggests there may be material upside if these cash flow assumptions play out.
Result: UNDERVALUED
Our Discounted Cash Flow (DCF) analysis suggests Apellis Pharmaceuticals is undervalued by 71.0%. Track this in your watchlist or portfolio, or discover 907 more undervalued stocks based on cash flows.

Approach 2: Apellis Pharmaceuticals Price vs Earnings
For profitable companies like Apellis, the price to earnings (PE) ratio is a useful way to gauge how much investors are paying for each dollar of current earnings. A higher PE can be justified when a business is growing quickly and its earnings are seen as relatively predictable, while slower growth or higher risk usually calls for a lower, more conservative multiple.
Apellis currently trades on a PE of about 70.96x, which is rich compared to the broader Biotechs industry average of roughly 19.05x and also above the 60.35x average of closer peers. To put this in better context, Simply Wall St calculates a proprietary Fair Ratio of 29.93x for Apellis, which estimates the multiple the company should trade on after considering its earnings growth outlook, risk profile, profitability, industry, and market cap.
This Fair Ratio is more informative than a simple comparison with peers or the industry because it explicitly adjusts for Apellis specific strengths and weaknesses rather than assuming it should trade like an average biotech. Lining up the numbers, the current PE of 70.96x sits well above the Fair Ratio of 29.93x, suggesting the shares are pricing in a very optimistic scenario.
Result: OVERVALUED

PE ratios tell one story, but what if the real opportunity lies elsewhere? Discover 1448 companies where insiders are betting big on explosive growth.
Upgrade Your Decision Making: Choose your Apellis Pharmaceuticals Narrative
Earlier we mentioned that there is an even better way to understand valuation, so let us introduce you to Narratives, a simple framework where you spell out your story for a company and link that story to specific assumptions about its future revenue, earnings and margins, which then combine into a fair value you can compare to today’s share price.
On Simply Wall St’s Community page, millions of investors use Narratives as an easy, accessible tool to connect a company’s qualitative story, such as new drug launches or regulatory risks, with a quantified forecast and resulting fair value that updates dynamically when fresh news, earnings or guidance is released.
For Apellis Pharmaceuticals, one investor’s Narrative might lean bullish and support a fair value closer to $60 per share based on strong uptake in kidney disease indications and sustained leadership in geographic atrophy. In contrast, a more cautious investor might build a Narrative that justifies something nearer $27 per share because of competitive threats, pricing pressure and execution risks. By comparing each Narrative’s fair value with the current price, you can decide whether Apellis looks attractive to you as a potential investment according to your own story, rather than relying solely on static multiples like the PE ratio.
Do you think there's more to the story for Apellis Pharmaceuticals? Head over to our Community to see what others are saying!
This article by Simply Wall St is general in nature. We provide commentary based on historical data and analyst forecasts only using an unbiased methodology and our articles are not intended to be financial advice. It does not constitute a recommendation to buy or sell any stock, and does not take account of your objectives, or your financial situation. We aim to bring you long-term focused analysis driven by fundamental data. Note that our analysis may not factor in the latest price-sensitive company announcements or qualitative material. Simply Wall St has no position in any stocks mentioned.
Have feedback on this article? Concerned about the content? Get in touch with us directly. Alternatively, email editorial-team@simplywallst.com