
- PREMIUM
- LIVE QUOTES
- INSTITUTIONS
 Index Options
 State Street
 CME Group
 Nasdaq
 Cboe
Cboe TradingView
 Wall Street Journal
Mid Penn Bancorp, Inc.'s (NASDAQ:MPB) one-year returns climbed after last week's 7.6% gain, institutional investors must be happy
Key Insights
- Significantly high institutional ownership implies Mid Penn Bancorp's stock price is sensitive to their trading actions
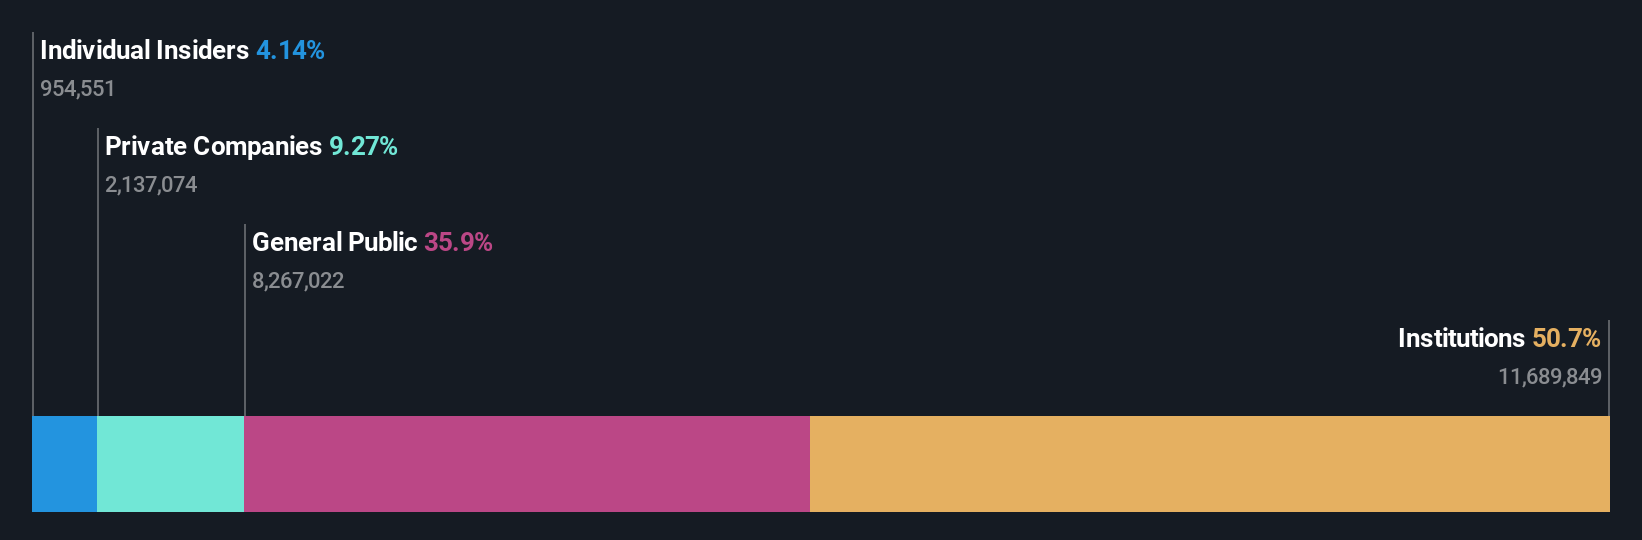
- The top 20 shareholders own 50% of the company
- Recent purchases by insiders
If you want to know who really controls Mid Penn Bancorp, Inc. (NASDAQ:MPB), then you'll have to look at the makeup of its share registry. We can see that institutions own the lion's share in the company with 51% ownership. Put another way, the group faces the maximum upside potential (or downside risk).
And things are looking up for institutional investors after the company gained US$52m in market cap last week. One-year return to shareholders is currently 7.0% and last week’s gain was the icing on the cake.
Let's delve deeper into each type of owner of Mid Penn Bancorp, beginning with the chart below.
Check out our latest analysis for Mid Penn Bancorp
What Does The Institutional Ownership Tell Us About Mid Penn Bancorp?
Institutional investors commonly compare their own returns to the returns of a commonly followed index. So they generally do consider buying larger companies that are included in the relevant benchmark index.
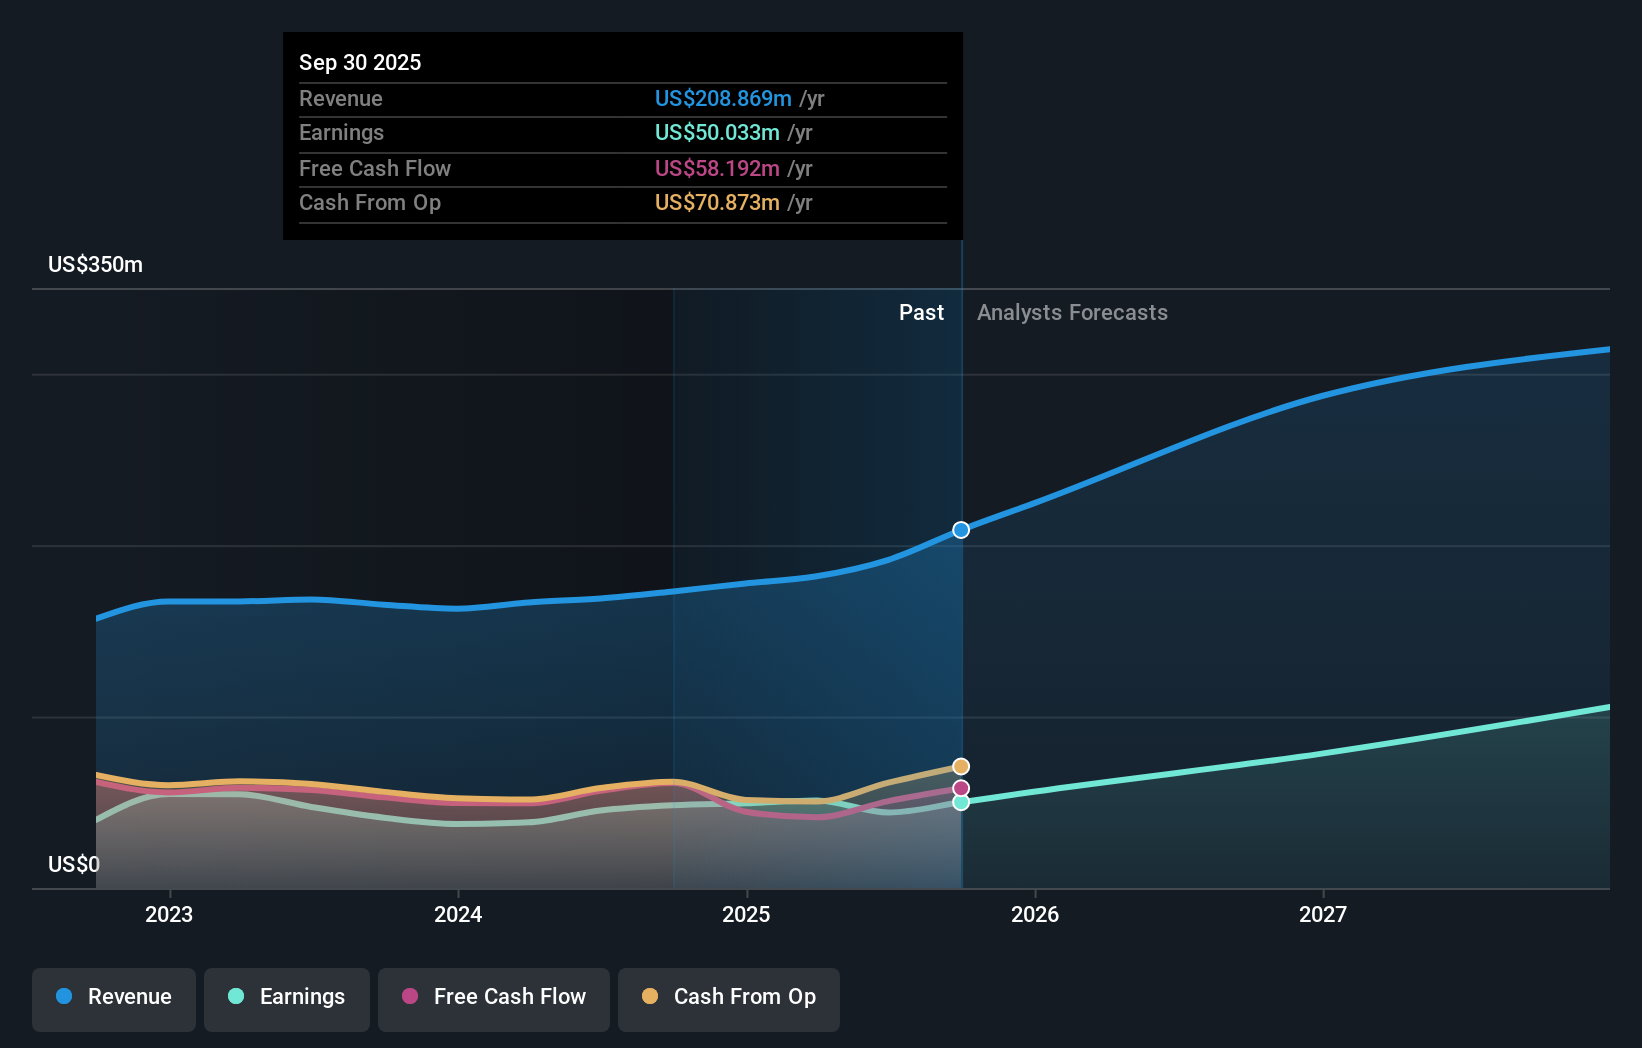
Mid Penn Bancorp already has institutions on the share registry. Indeed, they own a respectable stake in the company. This can indicate that the company has a certain degree of credibility in the investment community. However, it is best to be wary of relying on the supposed validation that comes with institutional investors. They too, get it wrong sometimes. When multiple institutions own a stock, there's always a risk that they are in a 'crowded trade'. When such a trade goes wrong, multiple parties may compete to sell stock fast. This risk is higher in a company without a history of growth. You can see Mid Penn Bancorp's historic earnings and revenue below, but keep in mind there's always more to the story.
Institutional investors own over 50% of the company, so together than can probably strongly influence board decisions. Hedge funds don't have many shares in Mid Penn Bancorp. Looking at our data, we can see that the largest shareholder is Wellington Management Group LLP with 9.7% of shares outstanding. Indiana Pacific General Trust is the second largest shareholder owning 9.3% of common stock, and BlackRock, Inc. holds about 6.3% of the company stock.
Looking at the shareholder registry, we can see that 50% of the ownership is controlled by the top 20 shareholders, meaning that no single shareholder has a majority interest in the ownership.
Researching institutional ownership is a good way to gauge and filter a stock's expected performance. The same can be achieved by studying analyst sentiments. There is some analyst coverage of the stock, but it could still become more well known, with time.
Insider Ownership Of Mid Penn Bancorp
The definition of an insider can differ slightly between different countries, but members of the board of directors always count. Company management run the business, but the CEO will answer to the board, even if he or she is a member of it.
I generally consider insider ownership to be a good thing. However, on some occasions it makes it more difficult for other shareholders to hold the board accountable for decisions.
Our most recent data indicates that insiders own some shares in Mid Penn Bancorp, Inc.. As individuals, the insiders collectively own US$31m worth of the US$737m company. This shows at least some alignment. You can click here to see if those insiders have been buying or selling.
General Public Ownership
The general public, who are usually individual investors, hold a 36% stake in Mid Penn Bancorp. This size of ownership, while considerable, may not be enough to change company policy if the decision is not in sync with other large shareholders.
Private Company Ownership
We can see that Private Companies own 9.3%, of the shares on issue. It's hard to draw any conclusions from this fact alone, so its worth looking into who owns those private companies. Sometimes insiders or other related parties have an interest in shares in a public company through a separate private company.
Next Steps:
While it is well worth considering the different groups that own a company, there are other factors that are even more important. To that end, you should be aware of the 2 warning signs we've spotted with Mid Penn Bancorp .
Ultimately the future is most important. You can access this free report on analyst forecasts for the company.
NB: Figures in this article are calculated using data from the last twelve months, which refer to the 12-month period ending on the last date of the month the financial statement is dated. This may not be consistent with full year annual report figures.
Have feedback on this article? Concerned about the content? Get in touch with us directly. Alternatively, email editorial-team (at) simplywallst.com.
This article by Simply Wall St is general in nature. We provide commentary based on historical data and analyst forecasts only using an unbiased methodology and our articles are not intended to be financial advice. It does not constitute a recommendation to buy or sell any stock, and does not take account of your objectives, or your financial situation. We aim to bring you long-term focused analysis driven by fundamental data. Note that our analysis may not factor in the latest price-sensitive company announcements or qualitative material. Simply Wall St has no position in any stocks mentioned.