
- PREMIUM
- LIVE QUOTES
- INSTITUTIONS
 Index Options
 State Street
 CME Group
 Nasdaq
 Cboe
Cboe TradingView
 Wall Street Journal
H&K (ENXTPA:MLHK): Reassessing Valuation After Strong Nine-Month 2025 Earnings Momentum
H&K (ENXTPA:MLHK) just posted stronger nine month 2025 results, with sales and profits up versus last year, and that earnings momentum is what has put the stock back on investors radar.
See our latest analysis for H&K.
Even with this earnings beat, the share price has had a rough run, with a roughly 60% year to date share price return decline and a similarly weak one year total shareholder return. This suggests sentiment is still catching up to the improving fundamentals.
If this turnaround story has you rethinking where the next opportunity might come from, it could be worth exploring aerospace and defense stocks as a broader hunting ground for ideas.
With earnings growing faster than sales and the share price still down sharply, investors now face a key question: does H&K trade at a discount that overlooks this momentum, or is the market already pricing in its future growth?
Price-to-Earnings of 47x: Is It Justified?
On a last close of €45, H&K trades at roughly 47 times earnings, a level that signals a rich valuation against sector benchmarks and history.
The price to earnings ratio compares the company’s share price with its per share earnings, effectively showing how many euros investors are paying for each euro of profit. For a defense manufacturer with established profitability, this multiple is often treated as a shorthand for how confidently the market is betting on future earnings durability and growth.
In H&K’s case, that 47x multiple looks demanding, suggesting investors who stay in the stock are assuming that the current upswing in earnings quality, margins and returns on equity can be sustained or improved from here. With earnings growth having recently accelerated, the market appears to be paying up for that momentum rather than offering a clear bargain entry point.
Compared with the broader European Aerospace and Defense industry multiple of 30.2x, H&K’s valuation stands out as significantly more expensive, even if it looks roughly in line with a tighter peer group on this metric. That premium implies H&K needs to keep outperforming operationally to justify its higher price tag.
See what the numbers say about this price — find out in our valuation breakdown.
Result: Price-to-earnings of 47x (OVERVALUED)
However, investors still face risks, including potential cuts to defense budgets and increased regulatory or political scrutiny that could weigh on future contract visibility.
Find out about the key risks to this H&K narrative.
Another Angle On Value
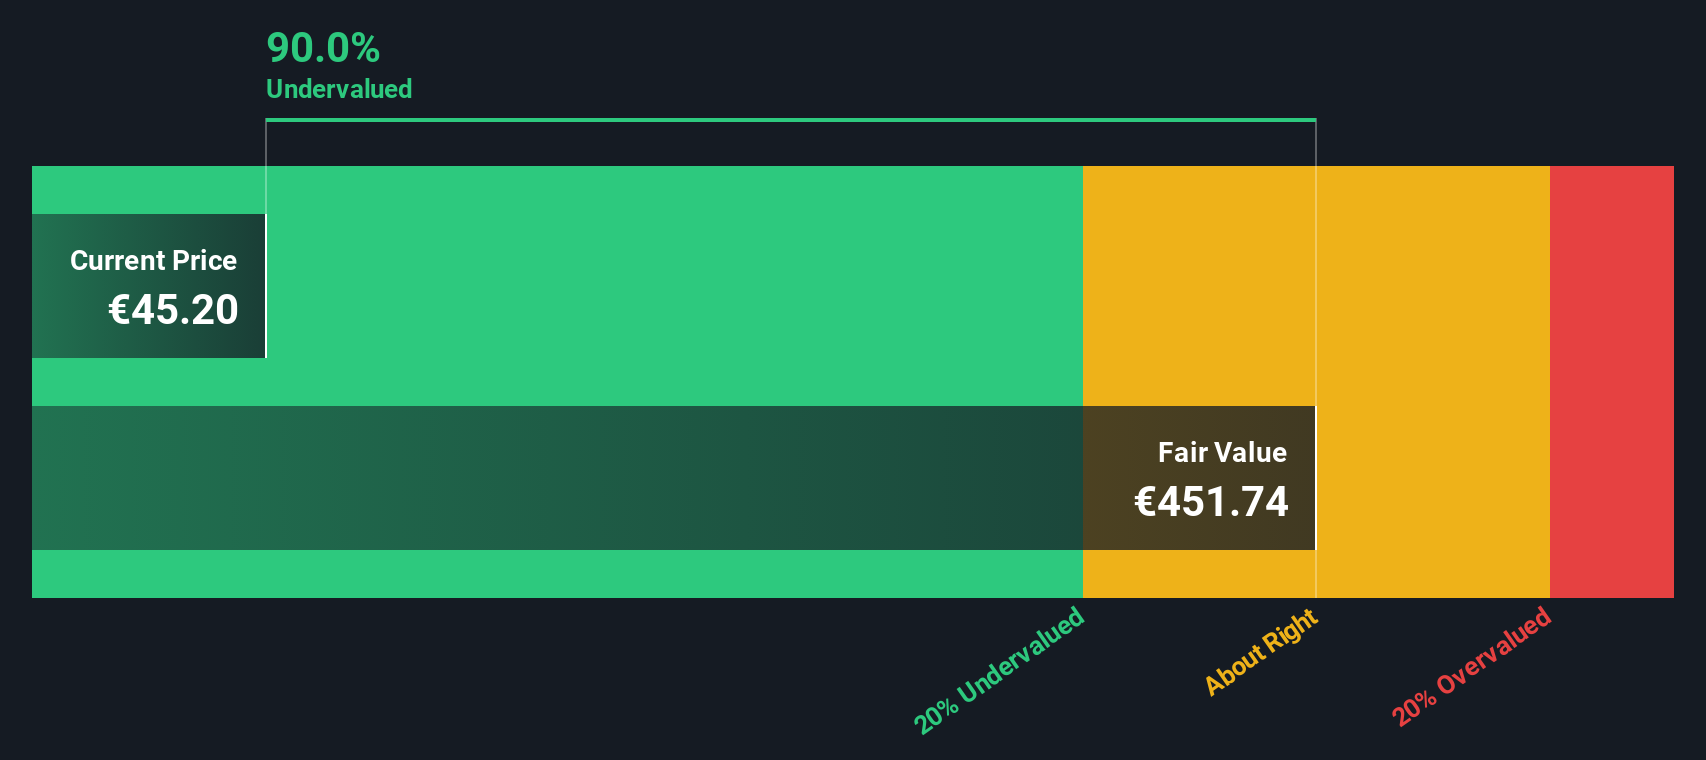
Our DCF model tells a very different story from the 47x earnings multiple, suggesting H&K is trading about 90% below its estimated fair value of roughly €455 per share. If both views cannot be right, which one is closer to how the market will think in a few years time?
Look into how the SWS DCF model arrives at its fair value.
Simply Wall St performs a discounted cash flow (DCF) on every stock in the world every day (check out H&K for example). We show the entire calculation in full. You can track the result in your watchlist or portfolio and be alerted when this changes, or use our stock screener to discover 903 undervalued stocks based on their cash flows. If you save a screener we even alert you when new companies match - so you never miss a potential opportunity.
Build Your Own H&K Narrative
If you would rather stress test the numbers yourself, you can quickly build a personalised view of H&K’s prospects in under three minutes by using Do it your way.
A great starting point for your H&K research is our analysis highlighting 2 key rewards and 1 important warning sign that could impact your investment decision.
Looking for more investment ideas?
Before you move on, consider scanning targeted stock ideas that could sharpen your portfolio positioning beyond H&K alone.
- Explore potential mispriced opportunities by reviewing these 903 undervalued stocks based on cash flows that may offer stronger upside relative to their current market expectations.
- Focus on these 25 AI penny stocks that are positioned to benefit from the adoption of artificial intelligence across industries.
- Strengthen your income stream by targeting these 12 dividend stocks with yields > 3% that can help support more resilient long term returns.
This article by Simply Wall St is general in nature. We provide commentary based on historical data and analyst forecasts only using an unbiased methodology and our articles are not intended to be financial advice. It does not constitute a recommendation to buy or sell any stock, and does not take account of your objectives, or your financial situation. We aim to bring you long-term focused analysis driven by fundamental data. Note that our analysis may not factor in the latest price-sensitive company announcements or qualitative material. Simply Wall St has no position in any stocks mentioned.
Have feedback on this article? Concerned about the content? Get in touch with us directly. Alternatively, email editorial-team@simplywallst.com