
- PREMIUM
- LIVE QUOTES
- INSTITUTIONS
 Index Options
 State Street
 CME Group
 Nasdaq
 Cboe
Cboe TradingView
 Wall Street Journal
Has the Market Already Rewarded Visa’s 2025 Rally or Is Upside Still Ahead?
- Wondering if Visa is still a buy at these levels, or if most of the upside has already been priced in? You are not alone. This is exactly where a closer look at valuation can give you an edge.
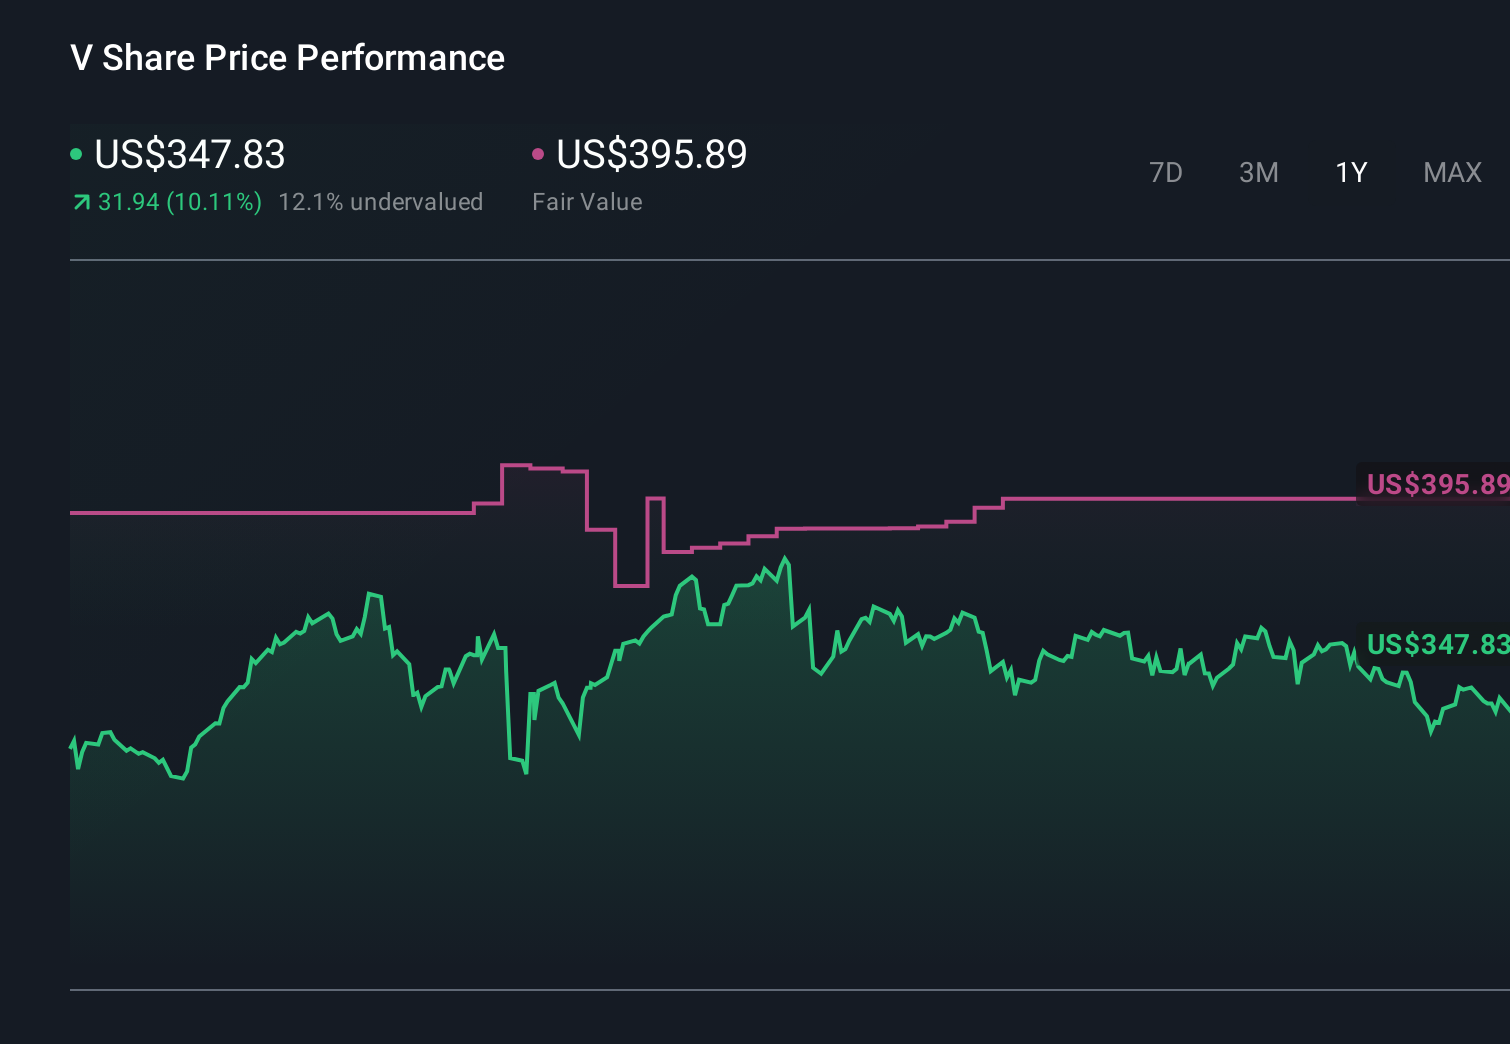
- Over the past week Visa has climbed 5.7%, is up 2.0% over the last month, and has gained 9.9% year to date, adding to a 10.8% return over the last year and roughly 70% over both three and five years.
- These moves have come as markets continue to reward dominant payment networks for their resilience and structural growth story, while also weighing regulatory and competitive headlines that occasionally rattle sentiment. Visa has stayed in the spotlight as digital payments keep expanding globally and investors debate how much future growth is already reflected in the share price.
- Despite all that, Visa only scores 1/6 on our undervaluation checks, suggesting that by some traditional metrics it may not look especially cheap, at least at first glance. Next we will unpack how different valuation approaches judge the stock, and then we will finish with a more holistic way to think about what Visa is really worth.
Visa scores just 1/6 on our valuation checks. See what other red flags we found in the full valuation breakdown.
Approach 1: Visa Excess Returns Analysis
The Excess Returns model looks at how much profit a company can generate above the minimum return shareholders require, and then projects how long those superior returns can persist.
For Visa, the starting balance sheet is strong, with a Book Value of $19.38 per share and a Stable Book Value estimate of $22.67 per share, based on forecasts from 9 analysts. On that equity base, Visa is expected to earn Stable EPS of $16.35 per share, implying an Average Return on Equity of 72.11%, which is far above what most businesses can sustainably generate.
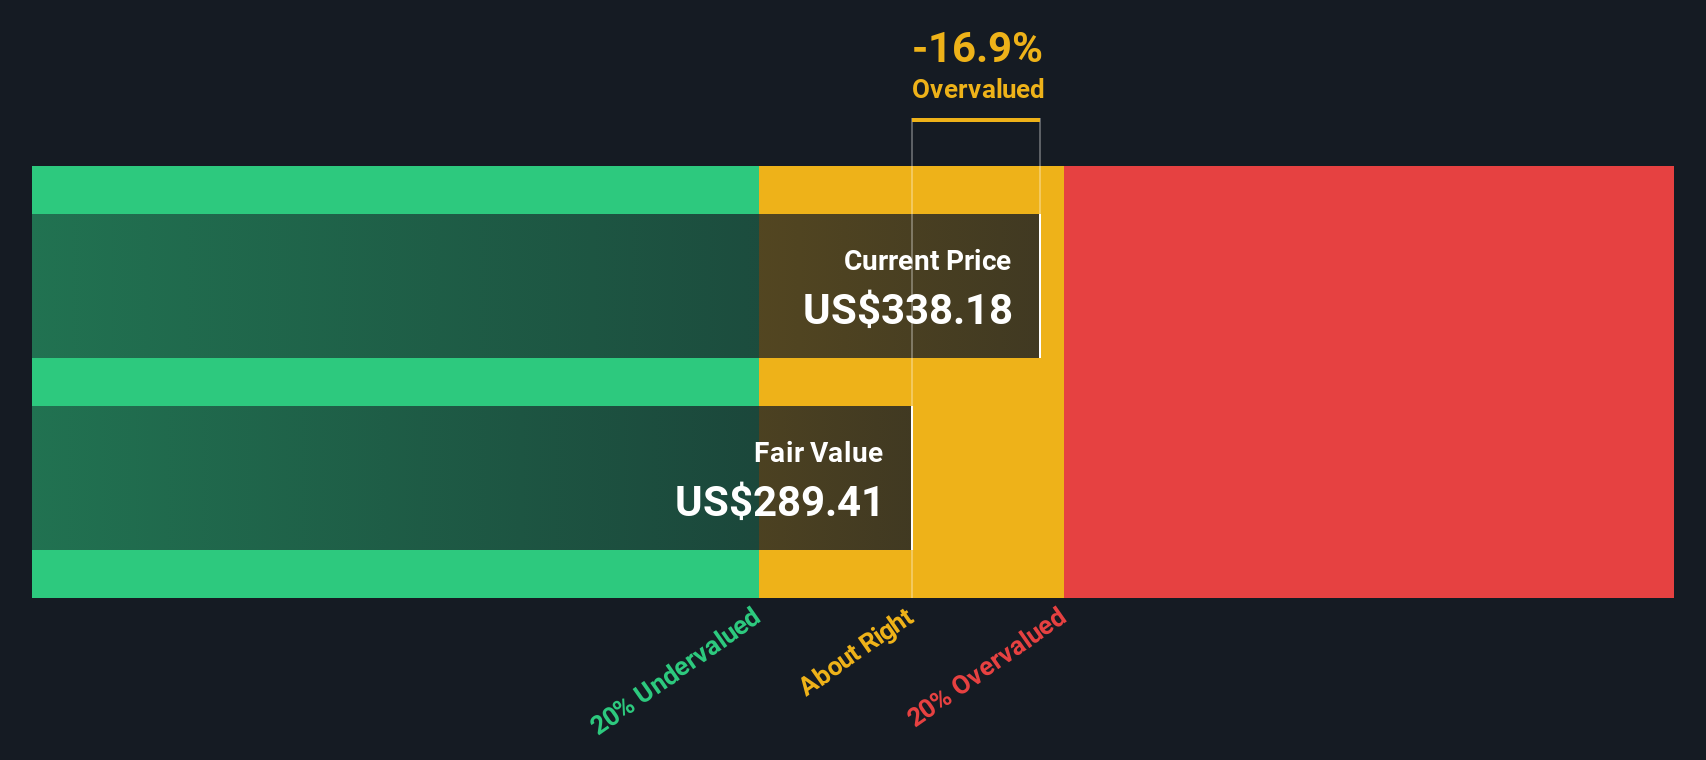
Shareholders are assumed to require a Cost of Equity of $1.68 per share. The model therefore calculates an Excess Return of $14.67 per share, essentially the value created above that required return each year. By capitalizing these excess profits over time, the Excess Returns framework arrives at an intrinsic value of about $376 per share.
With this implying roughly an 8.1% discount to the current price, the model suggests Visa is only slightly undervalued rather than a screaming bargain.
Result: ABOUT RIGHT
Visa is fairly valued according to our Excess Returns, but this can change at a moment's notice. Track the value in your watchlist or portfolio and be alerted on when to act.
Approach 2: Visa Price vs Earnings
For a mature, highly profitable business like Visa, the price to earnings ratio is usually the cleanest way to gauge value because it links what investors pay today to the profits the company is already generating. In general, companies with faster, more reliable earnings growth and lower perceived risk can justify higher PE multiples, while slower or riskier businesses tend to trade on lower ones.
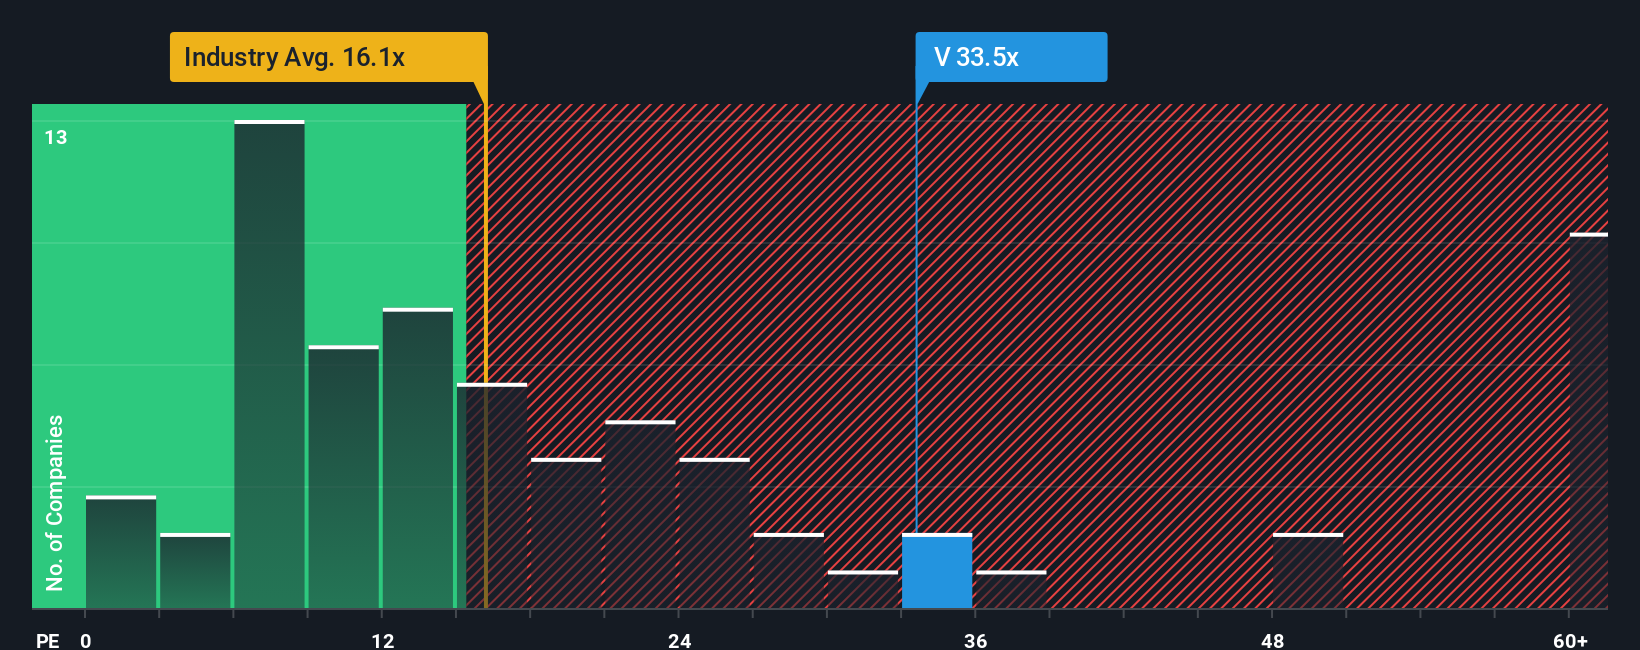
Visa currently trades on a PE of about 33.3x, which is well above the Diversified Financial industry average of roughly 13.6x and also ahead of its peer group average of around 17.4x. To go beyond simple comparisons, Simply Wall St calculates a Fair Ratio of about 20.1x, which is the PE you might expect given Visa’s earnings growth outlook, profitability, industry, market cap and risk profile. This Fair Ratio is more robust than a straight peer or industry comparison because it explicitly adjusts for how fast Visa is growing and how durable those profits appear to be.
Set against that 20.1x Fair Ratio, the current 33.3x PE suggests investors are paying a meaningful premium for Visa’s quality and growth, leaving the stock looking expensive on this measure.
Result: OVERVALUED
PE ratios tell one story, but what if the real opportunity lies elsewhere? Discover 1446 companies where insiders are betting big on explosive growth.
Upgrade Your Decision Making: Choose your Visa Narrative
Earlier we mentioned that there is an even better way to understand valuation, so let us introduce you to Narratives. This is a simple framework on Simply Wall St’s Community page that lets you connect your view of a company’s story to a set of forecasts for revenue, earnings and margins. These then roll up into a fair value you can compare against today’s share price to see whether it looks like a buy or a sell. Because Narratives are updated automatically as new news or earnings arrive, you can see in real time how the story and valuation change. For example, with Visa one investor might build a bullish Narrative around stablecoin expansion, cross border growth and rising margins to support a fair value near $430. Another, more cautious investor might factor in regulatory and competitive risks to arrive closer to $305. This shows how the same company can reasonably support very different, but clearly articulated and testable, investment cases.
Do you think there's more to the story for Visa? Head over to our Community to see what others are saying!
This article by Simply Wall St is general in nature. We provide commentary based on historical data and analyst forecasts only using an unbiased methodology and our articles are not intended to be financial advice. It does not constitute a recommendation to buy or sell any stock, and does not take account of your objectives, or your financial situation. We aim to bring you long-term focused analysis driven by fundamental data. Note that our analysis may not factor in the latest price-sensitive company announcements or qualitative material. Simply Wall St has no position in any stocks mentioned.
Have feedback on this article? Concerned about the content? Get in touch with us directly. Alternatively, email editorial-team@simplywallst.com