
- PREMIUM
- LIVE QUOTES
- INSTITUTIONS
 Index Options
 State Street
 CME Group
 Nasdaq
 Cboe
Cboe TradingView
 Wall Street Journal
Institutions profited after Di Dong Il Corporation's (KRX:001530) market cap rose ₩49b last week but individual investors profited the most
Key Insights
- Significant control over Di Dong Il by individual investors implies that the general public has more power to influence management and governance-related decisions
- 45% of the business is held by the top 23 shareholders
- Insiders own 12% of Di Dong Il
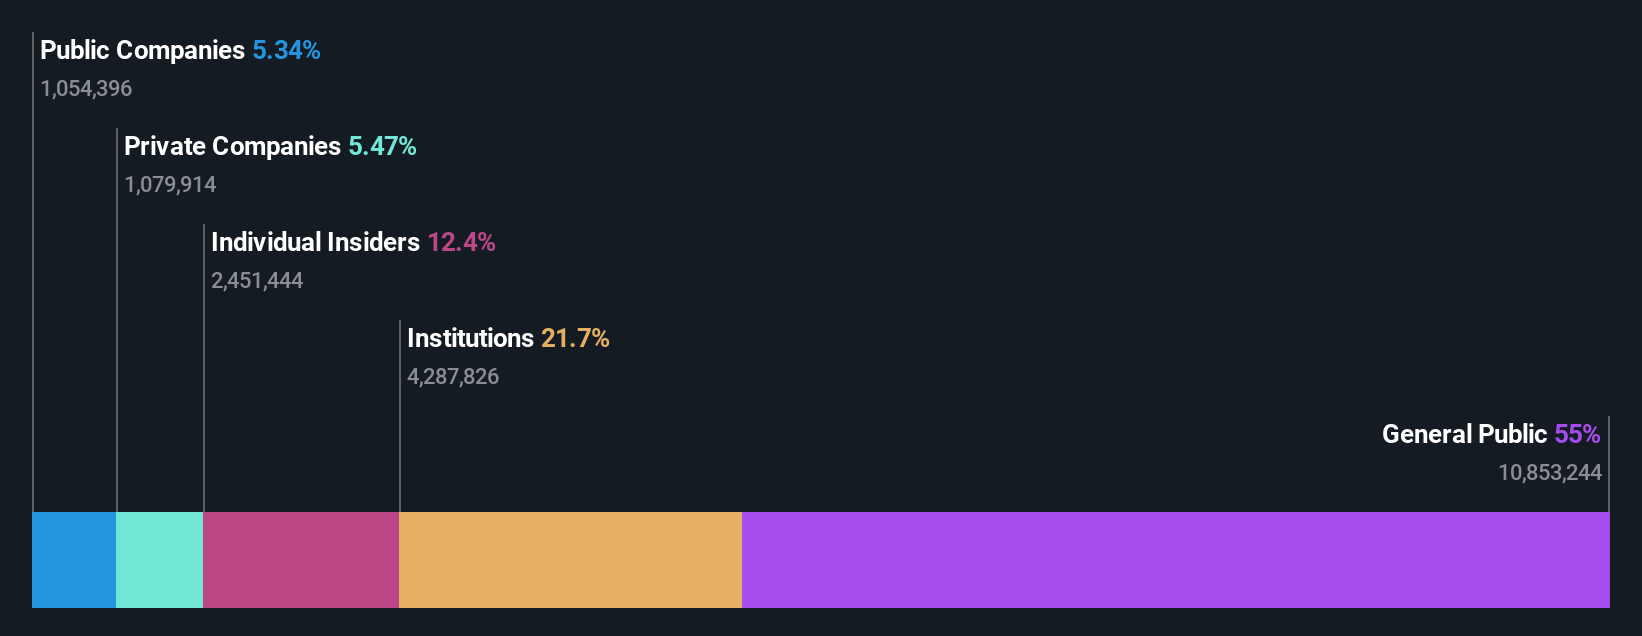
A look at the shareholders of Di Dong Il Corporation (KRX:001530) can tell us which group is most powerful. The group holding the most number of shares in the company, around 55% to be precise, is individual investors. Put another way, the group faces the maximum upside potential (or downside risk).
Individual investors gained the most after market cap touched ₩449b last week, while institutions who own 22% also benefitted.
In the chart below, we zoom in on the different ownership groups of Di Dong Il.
See our latest analysis for Di Dong Il
What Does The Institutional Ownership Tell Us About Di Dong Il?
Many institutions measure their performance against an index that approximates the local market. So they usually pay more attention to companies that are included in major indices.
Di Dong Il already has institutions on the share registry. Indeed, they own a respectable stake in the company. This implies the analysts working for those institutions have looked at the stock and they like it. But just like anyone else, they could be wrong. When multiple institutions own a stock, there's always a risk that they are in a 'crowded trade'. When such a trade goes wrong, multiple parties may compete to sell stock fast. This risk is higher in a company without a history of growth. You can see Di Dong Il's historic earnings and revenue below, but keep in mind there's always more to the story.

Di Dong Il is not owned by hedge funds. The company's largest shareholder is Junghun Foundation, with ownership of 13%. Min-Suk Seo is the second largest shareholder owning 10% of common stock, and Samyang Holdings Corporation holds about 5.3% of the company stock. Additionally, the company's CEO Tae-Won Suh directly holds 2.1% of the total shares outstanding.
On studying our ownership data, we found that 23 of the top shareholders collectively own less than 50% of the share register, implying that no single individual has a majority interest.
While it makes sense to study institutional ownership data for a company, it also makes sense to study analyst sentiments to know which way the wind is blowing. There is some analyst coverage of the stock, but it could still become more well known, with time.
Insider Ownership Of Di Dong Il
The definition of company insiders can be subjective and does vary between jurisdictions. Our data reflects individual insiders, capturing board members at the very least. Company management run the business, but the CEO will answer to the board, even if he or she is a member of it.
Insider ownership is positive when it signals leadership are thinking like the true owners of the company. However, high insider ownership can also give immense power to a small group within the company. This can be negative in some circumstances.
Our most recent data indicates that insiders own a reasonable proportion of Di Dong Il Corporation. Insiders own ₩56b worth of shares in the ₩449b company. This may suggest that the founders still own a lot of shares. You can click here to see if they have been buying or selling.
General Public Ownership
The general public -- including retail investors -- own 55% of Di Dong Il. This level of ownership gives investors from the wider public some power to sway key policy decisions such as board composition, executive compensation, and the dividend payout ratio.
Private Company Ownership
We can see that Private Companies own 5.5%, of the shares on issue. It's hard to draw any conclusions from this fact alone, so its worth looking into who owns those private companies. Sometimes insiders or other related parties have an interest in shares in a public company through a separate private company.
Public Company Ownership
Public companies currently own 5.3% of Di Dong Il stock. We can't be certain but it is quite possible this is a strategic stake. The businesses may be similar, or work together.
Next Steps:
It's always worth thinking about the different groups who own shares in a company. But to understand Di Dong Il better, we need to consider many other factors. Case in point: We've spotted 2 warning signs for Di Dong Il you should be aware of.
Ultimately the future is most important. You can access this free report on analyst forecasts for the company.
NB: Figures in this article are calculated using data from the last twelve months, which refer to the 12-month period ending on the last date of the month the financial statement is dated. This may not be consistent with full year annual report figures.
Have feedback on this article? Concerned about the content? Get in touch with us directly. Alternatively, email editorial-team (at) simplywallst.com.
This article by Simply Wall St is general in nature. We provide commentary based on historical data and analyst forecasts only using an unbiased methodology and our articles are not intended to be financial advice. It does not constitute a recommendation to buy or sell any stock, and does not take account of your objectives, or your financial situation. We aim to bring you long-term focused analysis driven by fundamental data. Note that our analysis may not factor in the latest price-sensitive company announcements or qualitative material. Simply Wall St has no position in any stocks mentioned.