
- PREMIUM
- LIVE QUOTES
- INSTITUTIONS
 Index Options
 State Street
 CME Group
 Nasdaq
 Cboe
Cboe TradingView
 Wall Street Journal
Peab (OM:PEAB B) Valuation After New Sustainable Contracts in Falun and Stockholm
Peab (OM:PEAB B) just added two meaningful Swedish contracts to its pipeline: a SEK 177 million retirement home in Falun and a SEK 113 million fossil free infrastructure project in Stockholm's Meatpacking District.
See our latest analysis for Peab.
These fresh contracts land at a time when sentiment around Peab has been gradually improving, with the share price up 6.76 percent over the past month and a punchy 56.31 percent three year total shareholder return. This suggests momentum is quietly building rather than fading.
If these wins have you thinking about where else construction driven demand could show up, it might be worth scanning aerospace and defense stocks for other capital intensive names riding long term infrastructure and public spending trends.
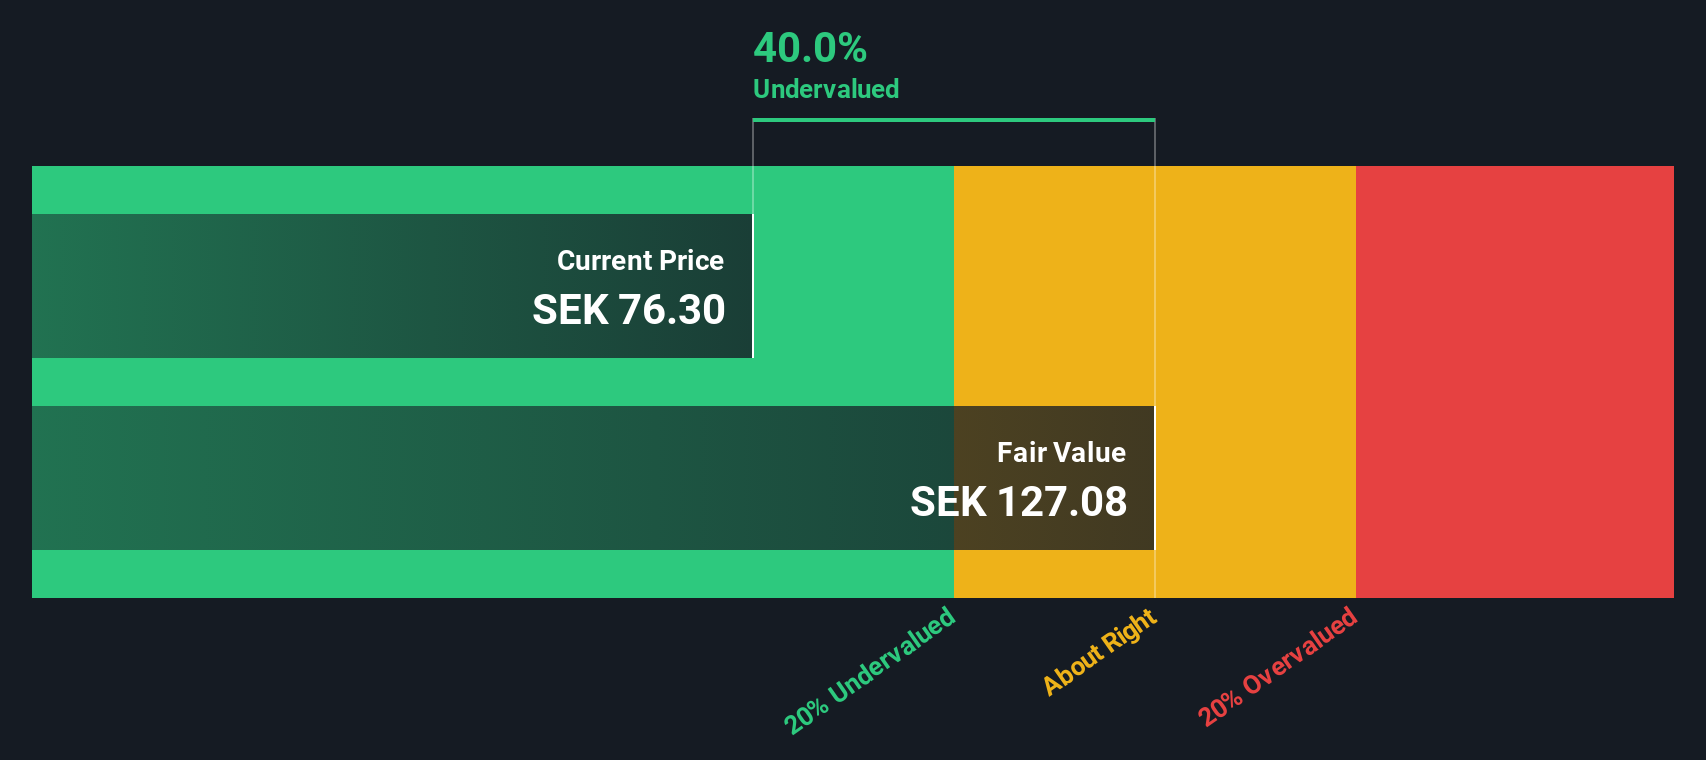
With the shares still trading at a double digit discount to analyst targets and an even larger implied gap to intrinsic value, the key question now is whether Peab remains undervalued or if the market is already pricing in this improving growth outlook.
Price to Earnings of 13.9x: Is it justified?
On a price to earnings ratio of 13.9x at the last close of SEK 80.5, Peab screens as undervalued relative to both peers and its own fair value marker.
The price to earnings multiple compares what investors pay today with the company’s current earnings. This is particularly important for a mature, cyclical construction and civil engineering group like Peab, where cash generation and profitability drive long term returns more than rapid growth.
Here, the market is paying less per unit of earnings than for similar construction names, despite forecasts calling for earnings to grow significantly faster than the broader Swedish market and a net profit trend that has already swung back to positive growth with improving margins.
Compared to the European construction industry’s average price to earnings of 14.8x and a statistically derived fair price to earnings ratio of 24.4x, Peab’s 13.9x multiple looks increasingly conservative, and this is interpreted as implying substantial room for the market multiple to expand toward that fair level if earnings deliveries continue.
Explore the SWS fair ratio for Peab
Result: Price-to-Earnings of 13.9x (UNDERVALUED)
However, cyclical construction demand, political shifts in public spending, or delays across Peab’s infrastructure pipeline could quickly cool both earnings momentum and investor enthusiasm.
Find out about the key risks to this Peab narrative.
Another View Using Our DCF Model
Our DCF model paints an even stronger picture, pointing to a fair value of roughly SEK 129 per share versus today’s SEK 80.5. That near 38 percent gap still flags Peab as materially undervalued. The key question is how much of that discount reflects real cycle risk rather than pure mispricing.
Look into how the SWS DCF model arrives at its fair value.
Simply Wall St performs a discounted cash flow (DCF) on every stock in the world every day (check out Peab for example). We show the entire calculation in full. You can track the result in your watchlist or portfolio and be alerted when this changes, or use our stock screener to discover 909 undervalued stocks based on their cash flows. If you save a screener we even alert you when new companies match - so you never miss a potential opportunity.
Build Your Own Peab Narrative
If you see the story differently or want to stress test the numbers yourself, you can build a complete view in just minutes: Do it your way.
A great starting point for your Peab research is our analysis highlighting 3 key rewards and 3 important warning signs that could impact your investment decision.
Looking for more investment ideas?
Do not stop at one opportunity. Use the Simply Wall Street Screener to quickly target stocks that match your strategy and help you stay ahead of other investors.
- Capture potential multi baggers early by scanning these 3607 penny stocks with strong financials. Improving fundamentals can turn small positions into meaningful portfolio drivers.
- Position your portfolio for the next productivity wave by targeting automation leaders through these 25 AI penny stocks. This screener focuses on scalable, data driven business models.
- Seek quality at attractive prices with these 909 undervalued stocks based on cash flows. It is built to surface companies whose current cash flow power may not yet be fully reflected in their share price.
This article by Simply Wall St is general in nature. We provide commentary based on historical data and analyst forecasts only using an unbiased methodology and our articles are not intended to be financial advice. It does not constitute a recommendation to buy or sell any stock, and does not take account of your objectives, or your financial situation. We aim to bring you long-term focused analysis driven by fundamental data. Note that our analysis may not factor in the latest price-sensitive company announcements or qualitative material. Simply Wall St has no position in any stocks mentioned.
Have feedback on this article? Concerned about the content? Get in touch with us directly. Alternatively, email editorial-team@simplywallst.com