
- PREMIUM
- LIVE QUOTES
- INSTITUTIONS
 Index Options
 State Street
 CME Group
 Nasdaq
 Cboe
Cboe TradingView
 Wall Street Journal
Has Globant’s 2025 AI and Cloud Expansion Created a New Value Opportunity?
- Wondering if Globant is a beaten down tech name or a quiet value opportunity waiting to be rediscovered? This breakdown will help you decide whether the current price really makes sense.
- Despite a modest 7.9% rise over the last month, the stock is still down 67.7% year to date and 68.7% over the past year, which indicates that sentiment has been heavily reset even as some investors are starting to edge back in.
- Recent news has focused on Globant doubling down on digital transformation, AI and cloud partnerships, as well as expanding its global delivery footprint. This reinforces the long term growth narrative even while the share price has struggled. There has also been increasing attention on how its exposure to enterprise tech spending cycles and competitive pressures from larger consultancies might be contributing to the volatility.
- Right now Globant scores a 4/6 valuation check on Simply Wall St, as shown in this valuation summary. Next, we will unpack what that actually means across different valuation approaches, before finishing with a more holistic way to judge whether the stock may represent good value.
Find out why Globant's -68.7% return over the last year is lagging behind its peers.
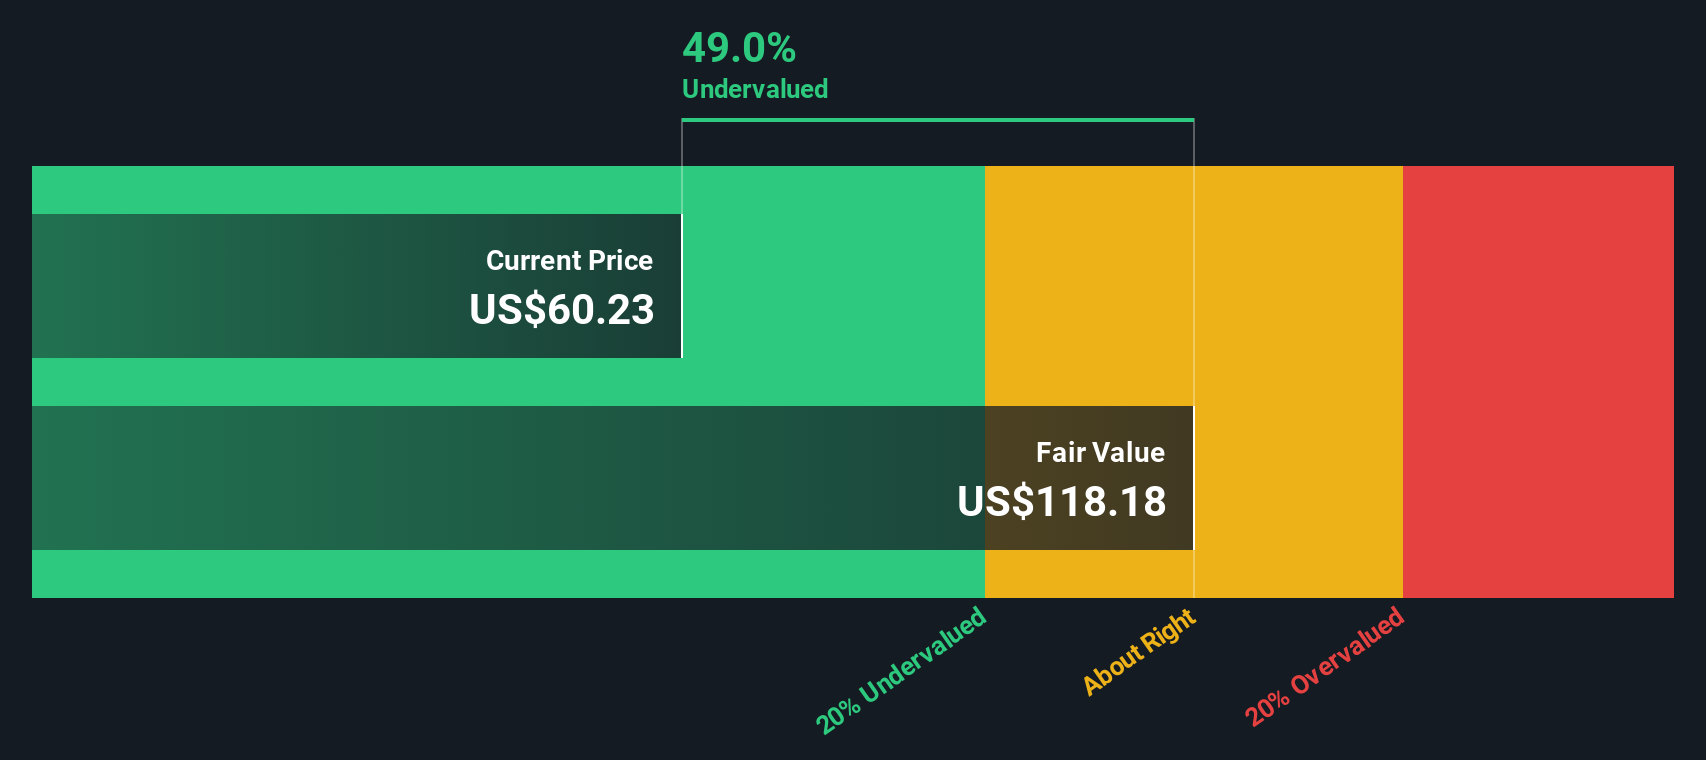
Approach 1: Globant Discounted Cash Flow (DCF) Analysis
The Discounted Cash Flow model estimates what a company is worth by projecting the cash it can generate in the future and then discounting those cash flows back to today in dollar terms. For Globant, the 2 Stage Free Cash Flow to Equity model starts from last twelve months free cash flow of about $133.7 million and uses analyst forecasts for the next few years, with further projections extrapolated by Simply Wall St to extend the outlook.
Under this framework, free cash flow is expected to grow to around $405.2 million by 2035, with intermediate years such as 2026 and 2029 projected at roughly $261.8 million and $323.6 million respectively. When these projected cash flows are discounted back, the model arrives at an intrinsic value of about $121.47 per share.
Compared with the current share price, this implies Globant trades at roughly a 43.3% discount to its estimated fair value. This suggests a meaningful margin of safety if the cash flow projections prove broadly accurate.
Result: UNDERVALUED
Our Discounted Cash Flow (DCF) analysis suggests Globant is undervalued by 43.3%. Track this in your watchlist or portfolio, or discover 909 more undervalued stocks based on cash flows.
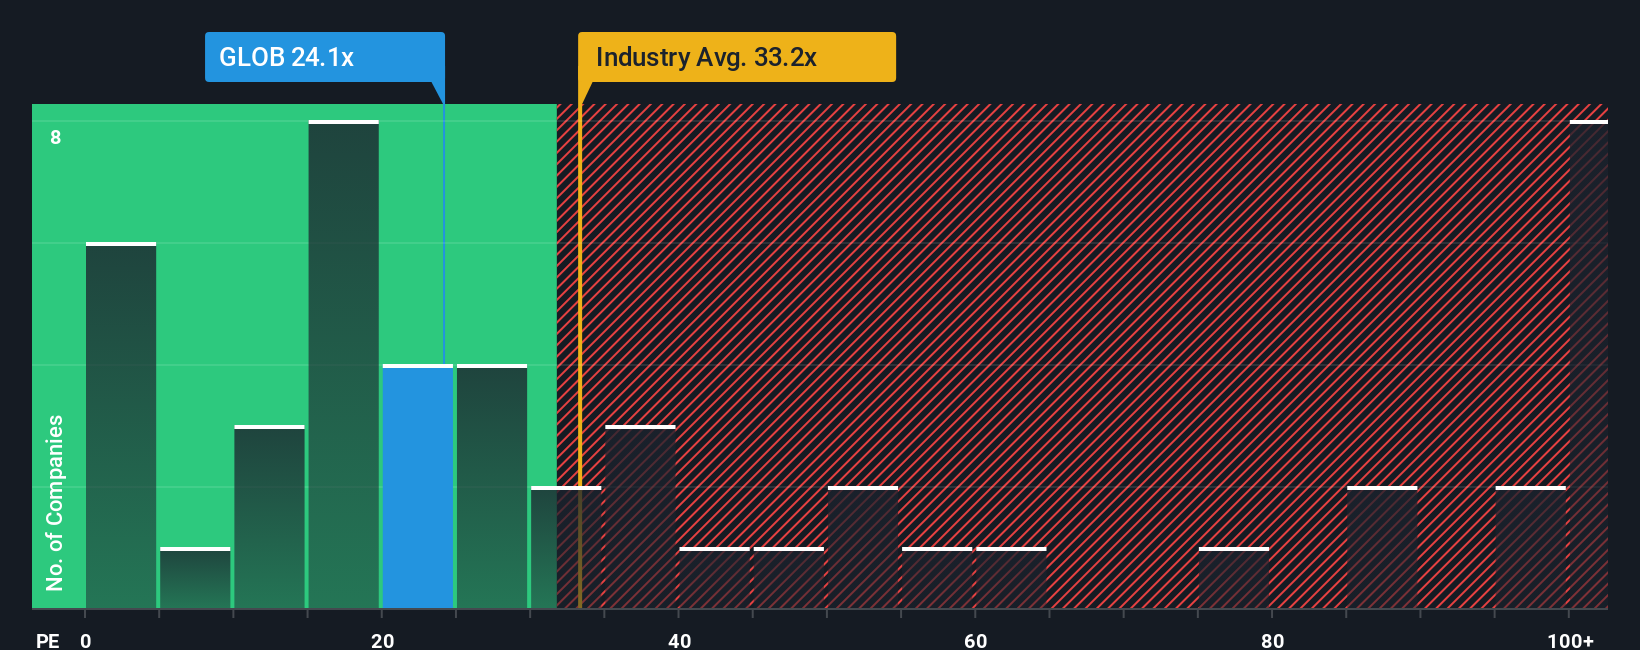
Approach 2: Globant Price vs Earnings
For a profitable business like Globant, the Price to Earnings ratio is a useful way to gauge how much investors are currently willing to pay for each dollar of earnings. In general, companies with stronger growth prospects or lower perceived risk can justify higher PE ratios, while slower growth or higher uncertainty tends to pull a fair multiple down.
Globant currently trades on a PE of about 30.4x, which is slightly below the broader IT industry average of roughly 31.1x, but more than double the peer group average of around 13.2x. To go a step further, Simply Wall St calculates a proprietary Fair Ratio of 40.7x for Globant, which represents the PE that might be expected given its specific earnings growth profile, profitability, industry, size and risk characteristics.
This Fair Ratio is more informative than a simple peer or industry comparison because it is tailored to Globant. It captures its higher growth outlook and risk factors rather than assuming it should trade in line with a generic sector multiple. With the Fair Ratio of 40.7x sitting meaningfully above the actual 30.4x, the PE lens indicates that Globant may be undervalued at current levels.
Result: UNDERVALUED
PE ratios tell one story, but what if the real opportunity lies elsewhere? Discover 1446 companies where insiders are betting big on explosive growth.
Upgrade Your Decision Making: Choose your Globant Narrative
Earlier we mentioned that there is an even better way to understand valuation. Let us introduce you to Narratives, a simple, story driven framework on Simply Wall St’s Community page that lets you spell out your view of Globant’s future revenues, earnings and margins, link that story to a financial forecast, and see what fair value it implies. You can then compare that fair value to today’s share price to decide whether to buy, hold or sell, with the numbers automatically updating as new news or earnings arrive. For example, a bullish investor might build a Narrative around AI driven expansion, higher margins and a fair value closer to the bullish 240 dollar target, while a more cautious investor might focus on slow IT spending, competitive pressure and a fair value nearer the low 74 dollar target.
Do you think there's more to the story for Globant? Head over to our Community to see what others are saying!

This article by Simply Wall St is general in nature. We provide commentary based on historical data and analyst forecasts only using an unbiased methodology and our articles are not intended to be financial advice. It does not constitute a recommendation to buy or sell any stock, and does not take account of your objectives, or your financial situation. We aim to bring you long-term focused analysis driven by fundamental data. Note that our analysis may not factor in the latest price-sensitive company announcements or qualitative material. Simply Wall St has no position in any stocks mentioned.
Have feedback on this article? Concerned about the content? Get in touch with us directly. Alternatively, email editorial-team@simplywallst.com