
- PREMIUM
- LIVE QUOTES
- INSTITUTIONS
 Index Options
 State Street
 CME Group
 Nasdaq
 Cboe
Cboe TradingView
 Wall Street Journal
Kobe Bussan Co., Ltd.'s (TSE:3038) market cap decline of JP¥26b may not have as much of an impact on institutional owners after a year of 1.7% returns
Key Insights
- Given the large stake in the stock by institutions, Kobe Bussan's stock price might be vulnerable to their trading decisions
- The top 12 shareholders own 50% of the company
- Ownership research along with analyst forecasts data help provide a good understanding of opportunities in a stock
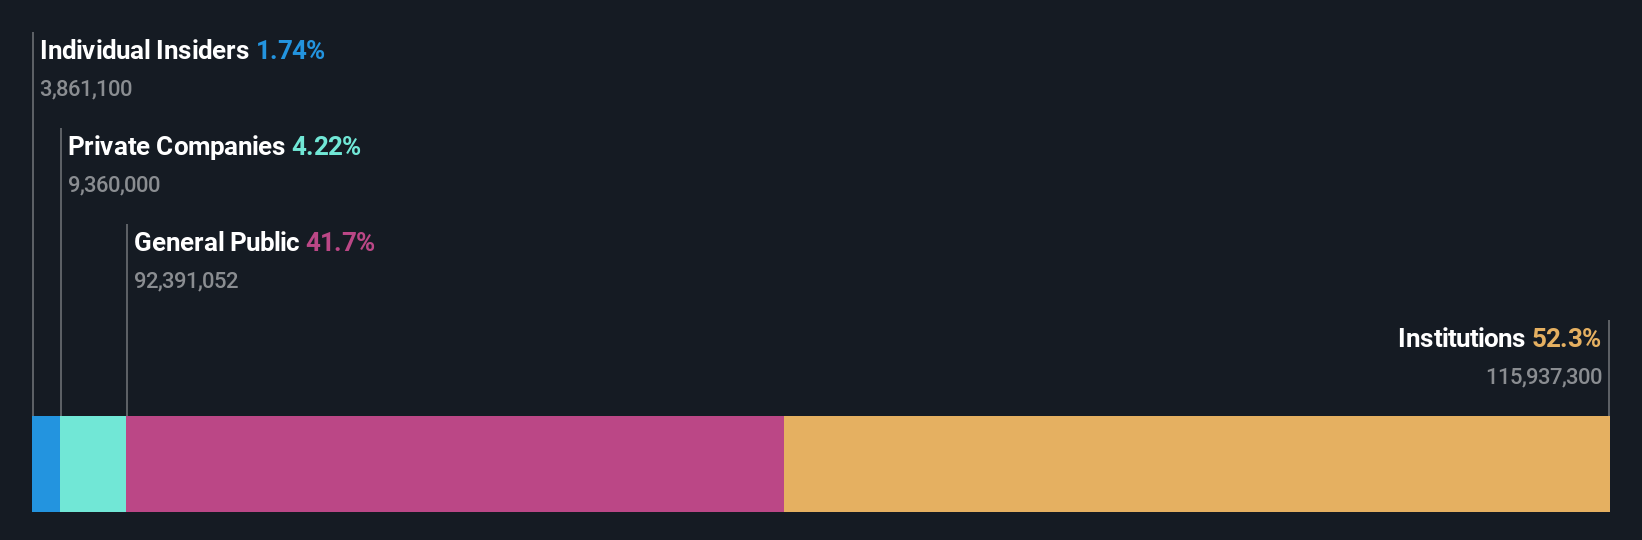
Every investor in Kobe Bussan Co., Ltd. (TSE:3038) should be aware of the most powerful shareholder groups. With 52% stake, institutions possess the maximum shares in the company. Put another way, the group faces the maximum upside potential (or downside risk).
Institutional investors was the group most impacted after the company's market cap fell to JP¥805b last week. However, the 1.7% one-year return to shareholders may have helped lessen their pain. But they would probably be wary of future losses.
Let's take a closer look to see what the different types of shareholders can tell us about Kobe Bussan.
View our latest analysis for Kobe Bussan
What Does The Institutional Ownership Tell Us About Kobe Bussan?
Institutional investors commonly compare their own returns to the returns of a commonly followed index. So they generally do consider buying larger companies that are included in the relevant benchmark index.
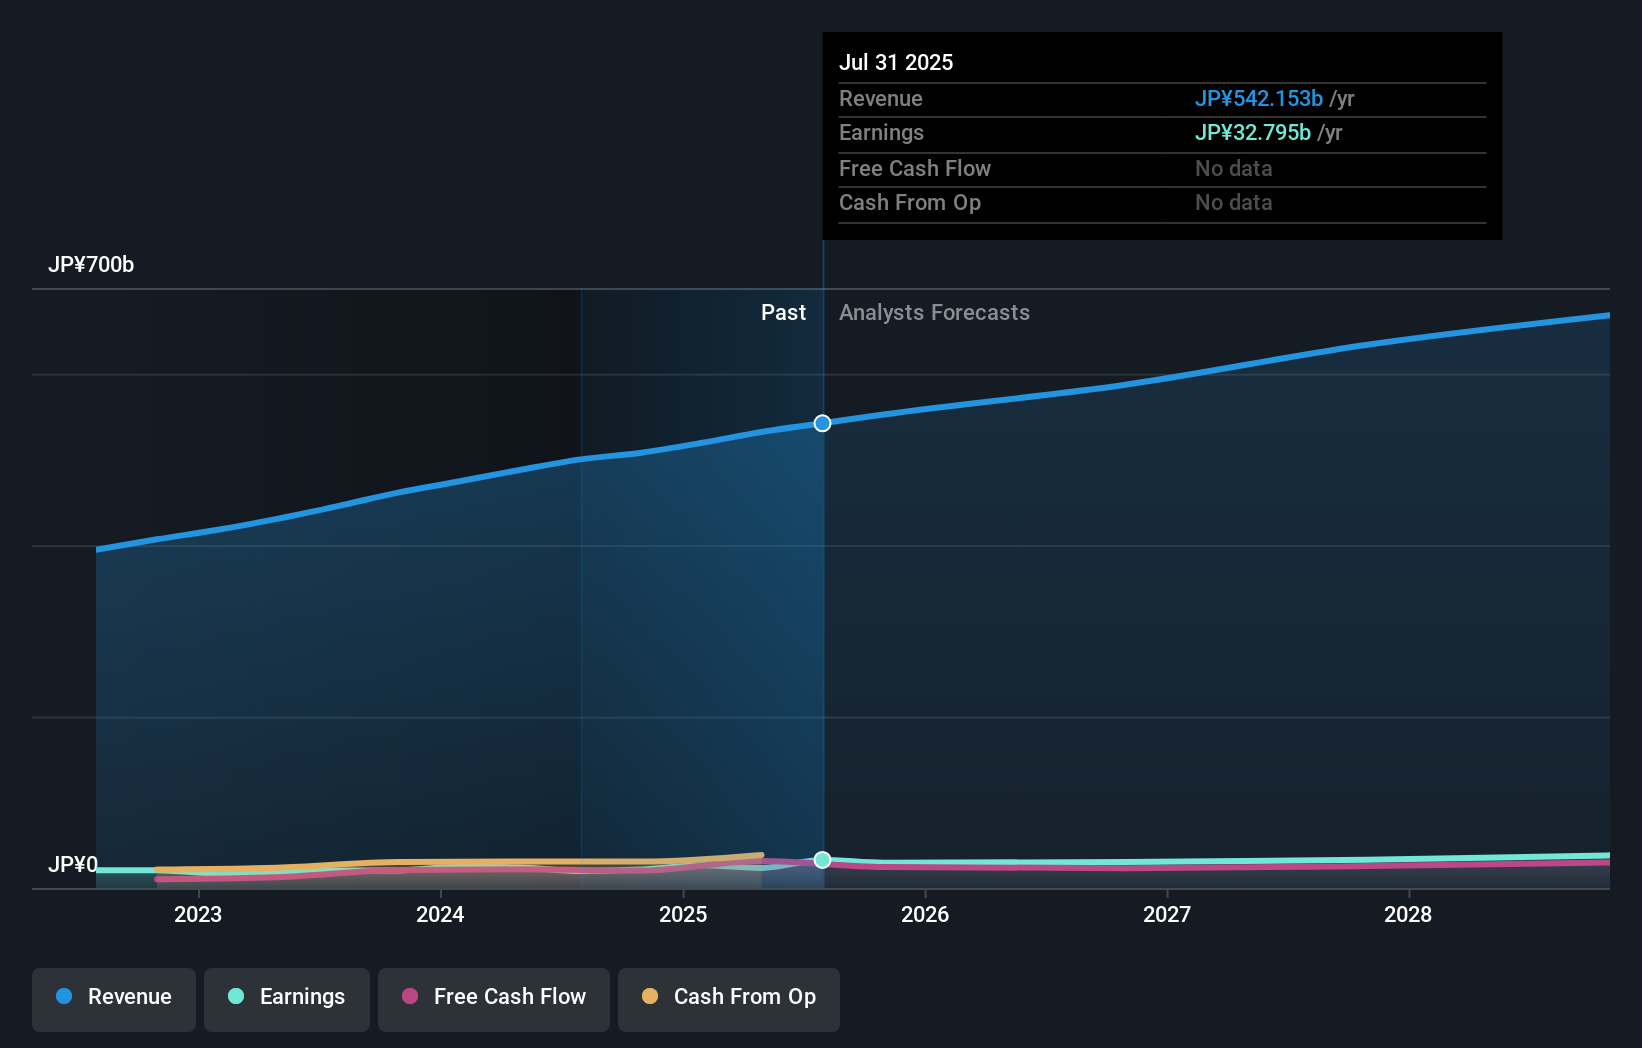
As you can see, institutional investors have a fair amount of stake in Kobe Bussan. This implies the analysts working for those institutions have looked at the stock and they like it. But just like anyone else, they could be wrong. It is not uncommon to see a big share price drop if two large institutional investors try to sell out of a stock at the same time. So it is worth checking the past earnings trajectory of Kobe Bussan, (below). Of course, keep in mind that there are other factors to consider, too.
Institutional investors own over 50% of the company, so together than can probably strongly influence board decisions. Hedge funds don't have many shares in Kobe Bussan. The company's largest shareholder is Gyomu Super Japan Dream Foundation, with ownership of 32%. With 2.7% and 2.6% of the shares outstanding respectively, Nomura Asset Management Co., Ltd. and The Vanguard Group, Inc. are the second and third largest shareholders. Additionally, the company's CEO Hirokazu Numata directly holds 1.7% of the total shares outstanding.
Looking at the shareholder registry, we can see that 50% of the ownership is controlled by the top 12 shareholders, meaning that no single shareholder has a majority interest in the ownership.
Researching institutional ownership is a good way to gauge and filter a stock's expected performance. The same can be achieved by studying analyst sentiments. There are plenty of analysts covering the stock, so it might be worth seeing what they are forecasting, too.
Insider Ownership Of Kobe Bussan
The definition of company insiders can be subjective and does vary between jurisdictions. Our data reflects individual insiders, capturing board members at the very least. Management ultimately answers to the board. However, it is not uncommon for managers to be executive board members, especially if they are a founder or the CEO.
Most consider insider ownership a positive because it can indicate the board is well aligned with other shareholders. However, on some occasions too much power is concentrated within this group.
Our most recent data indicates that insiders own some shares in Kobe Bussan Co., Ltd.. It is a pretty big company, so it is generally a positive to see some potentially meaningful alignment. In this case, they own around JP¥14b worth of shares (at current prices). If you would like to explore the question of insider alignment, you can click here to see if insiders have been buying or selling.
General Public Ownership
The general public, who are usually individual investors, hold a 42% stake in Kobe Bussan. While this size of ownership may not be enough to sway a policy decision in their favour, they can still make a collective impact on company policies.
Private Company Ownership
We can see that Private Companies own 4.2%, of the shares on issue. It might be worth looking deeper into this. If related parties, such as insiders, have an interest in one of these private companies, that should be disclosed in the annual report. Private companies may also have a strategic interest in the company.
Next Steps:
I find it very interesting to look at who exactly owns a company. But to truly gain insight, we need to consider other information, too. For instance, we've identified 1 warning sign for Kobe Bussan that you should be aware of.
If you would prefer discover what analysts are predicting in terms of future growth, do not miss this free report on analyst forecasts.
NB: Figures in this article are calculated using data from the last twelve months, which refer to the 12-month period ending on the last date of the month the financial statement is dated. This may not be consistent with full year annual report figures.
Have feedback on this article? Concerned about the content? Get in touch with us directly. Alternatively, email editorial-team (at) simplywallst.com.
This article by Simply Wall St is general in nature. We provide commentary based on historical data and analyst forecasts only using an unbiased methodology and our articles are not intended to be financial advice. It does not constitute a recommendation to buy or sell any stock, and does not take account of your objectives, or your financial situation. We aim to bring you long-term focused analysis driven by fundamental data. Note that our analysis may not factor in the latest price-sensitive company announcements or qualitative material. Simply Wall St has no position in any stocks mentioned.