
Klarna Group (KLAR): Assessing an Expensive Valuation After Recent Share Price Volatility
Klarna Group (KLAR) has been on a bumpy ride lately, with the stock sliding over the past 3 months even as revenue and net income growth point to an improving underlying business trajectory.
See our latest analysis for Klarna Group.
Despite the steady operational progress, Klarna Group’s share price return has been choppy, with a 1 day share price return of 4.76 percent and 7 day share price return of 5.07 percent, which partly offset a weaker 90 day share price return of negative 24.78 percent. This suggests sentiment is stabilising rather than surging around the current 32.15 dollars level.
If Klarna’s swings have you rethinking concentration risk, it could be a good moment to explore fast growing stocks with high insider ownership as potential additions to your watchlist.
With Klarna still loss making yet growing briskly and trading well below analyst targets, investors now face a key question: is the recent weakness a mispricing that opens a buying window, or is the market already discounting future gains?
Price-to-Sales of 3.8x: Is it justified?
Klarna Group currently trades on a price to sales ratio of 3.8 times, which leaves the stock looking expensive relative to both peers and the wider diversified financials space at its 32.15 dollars share price.
The price to sales multiple compares the company’s market value to its annual revenue, a useful lens for fast growing, still unprofitable fintech and payments businesses where earnings are not yet a stable guide. For Klarna, investors are effectively paying a premium today for the prospect that rapid top line expansion and improving profitability will eventually translate into stronger cash flows.
However, statements indicate that Klarna’s 3.8 times price to sales ratio is no bargain, it is described as expensive versus both its direct peer group, which also trades around 3.8 times sales, and the broader US diversified financial industry, which averages about 2.5 times sales. That suggests the market is already baking in superior growth and margin recovery, and if those expectations slip, the multiple could face pressure.
See what the numbers say about this price — find out in our valuation breakdown.
Result: Price-to-Sales of 3.8x (OVERVALUED)
However, risks remain, including execution missteps in scaling profitability and a tougher consumer credit cycle that could dampen growth and investor confidence.
Find out about the key risks to this Klarna Group narrative.
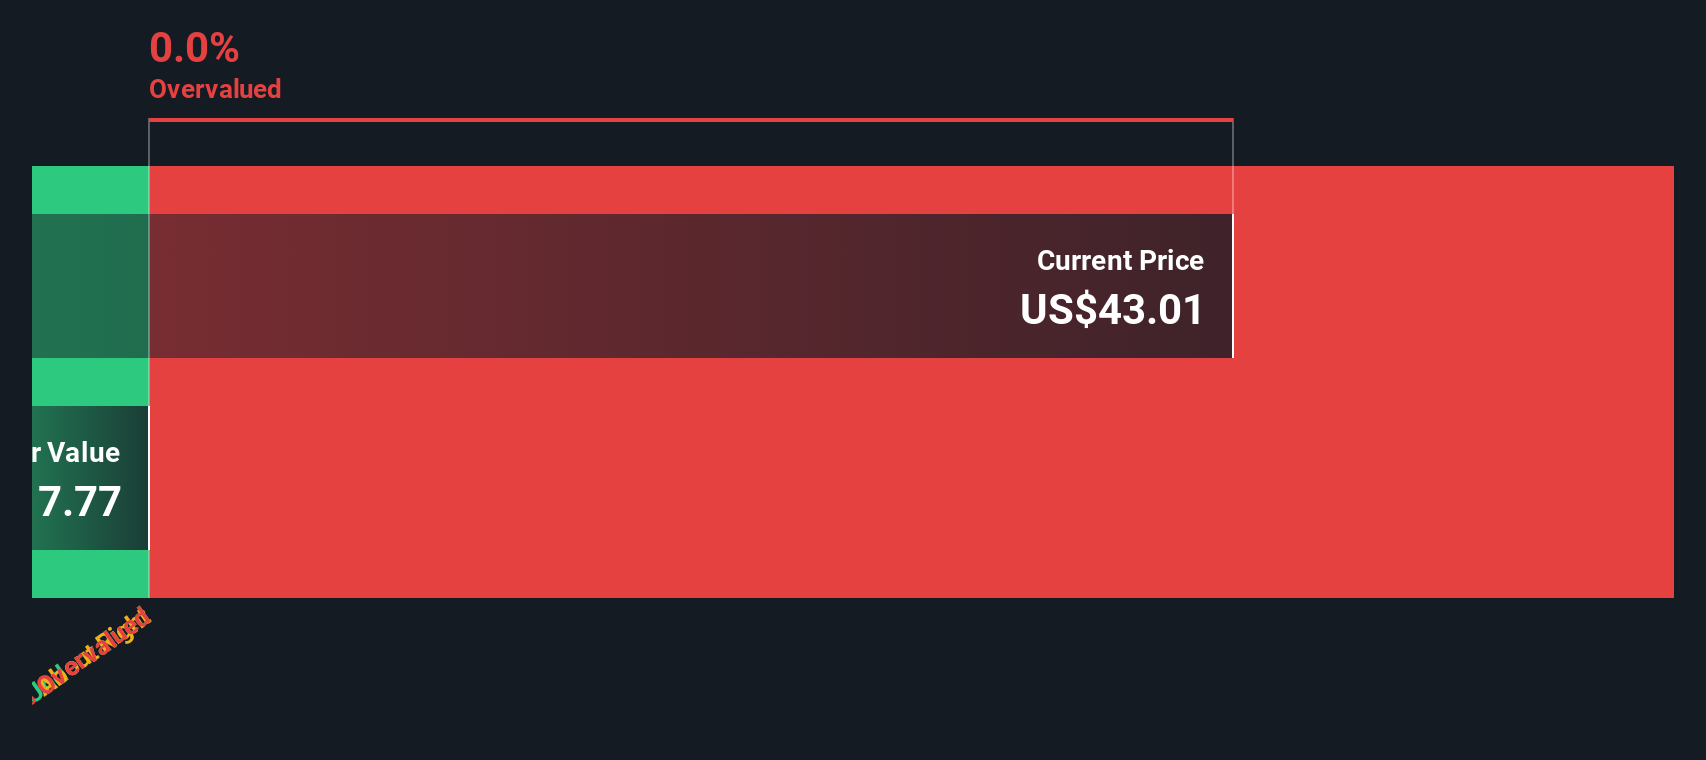
Another View: DCF Puts the Brakes On
While the 3.8 times price to sales ratio hints at a rich valuation, our DCF model is even harsher, suggesting fair value sits near 0.17 dollars, far below today’s 32.15 dollars price. Is the market pricing in blue sky, or is the model too conservative for a fast evolving fintech story?
Look into how the SWS DCF model arrives at its fair value.
Simply Wall St performs a discounted cash flow (DCF) on every stock in the world every day (check out Klarna Group for example). We show the entire calculation in full. You can track the result in your watchlist or portfolio and be alerted when this changes, or use our stock screener to discover 909 undervalued stocks based on their cash flows. If you save a screener we even alert you when new companies match - so you never miss a potential opportunity.
Build Your Own Klarna Group Narrative
If you would rather challenge these assumptions and dig into the numbers yourself, you can build a personalised view of Klarna in minutes: Do it your way.
A good starting point is our analysis highlighting 2 key rewards investors are optimistic about regarding Klarna Group.
Ready for more compelling opportunities?
Do not leave your next move to chance, use the Simply Wall St Screener to spot fresh, data driven ideas before the crowd catches on.
- Capture potential mispricings early by scanning these 909 undervalued stocks based on cash flows that may offer stronger cash flow upside than the market currently expects.
- Ride structural shifts in healthcare by reviewing these 30 healthcare AI stocks harnessing data, automation, and diagnostics to reshape patient outcomes and long term growth.
- Position yourself for the next wave of digital finance by evaluating these 81 cryptocurrency and blockchain stocks poised to benefit from blockchain adoption and alternative payment networks.
This article by Simply Wall St is general in nature. We provide commentary based on historical data and analyst forecasts only using an unbiased methodology and our articles are not intended to be financial advice. It does not constitute a recommendation to buy or sell any stock, and does not take account of your objectives, or your financial situation. We aim to bring you long-term focused analysis driven by fundamental data. Note that our analysis may not factor in the latest price-sensitive company announcements or qualitative material. Simply Wall St has no position in any stocks mentioned.
Have feedback on this article? Concerned about the content? Get in touch with us directly. Alternatively, email editorial-team@simplywallst.com