
Is It Too Late To Consider Samsung After Its 101% 2025 Rally?
- If you are wondering whether Samsung Electronics is still attractive after its huge run, or if you have already missed the boat, this breakdown will help you assess whether the current price makes sense or is getting ahead of itself.
- The stock has climbed 2.1% over the last week, 3.7% over the past month, and is up an eye catching 100.9% year to date, with a 96.5% gain over the last year that has dramatically changed how investors think about its upside and downside.
- Much of this strength has been driven by renewed optimism around memory chips and AI infrastructure demand, as Samsung is a key player in DRAM and advanced manufacturing. At the same time, headlines about the global semiconductor cycle turning up and large cap tech leadership in Korea have pulled in fresh momentum focused capital.
- Even after this rally, Samsung scores a 3/6 on Simply Wall St's valuation checks. This suggests that some metrics flag undervaluation while others look more fully priced. Next, we will unpack what different valuation methods indicate, before finishing with a more intuitive way to think about its value.
Find out why Samsung Electronics's 96.5% return over the last year is lagging behind its peers.
Approach 1: Samsung Electronics Discounted Cash Flow (DCF) Analysis
A Discounted Cash Flow model estimates what a company is worth by projecting all the cash it can generate in the future and then discounting those cash flows back to today in ₩ terms.
For Samsung Electronics, the latest twelve month Free Cash Flow is about ₩16.5 Trillion. Using a 2 stage Free Cash Flow to Equity model, analysts first project detailed cash flows for the next few years and then Simply Wall St extrapolates those estimates further out. On this basis, Free Cash Flow is expected to rise to roughly ₩121.1 Trillion by 2035, with growth slowing from high double digits in the near term to mid single digit rates later in the decade.
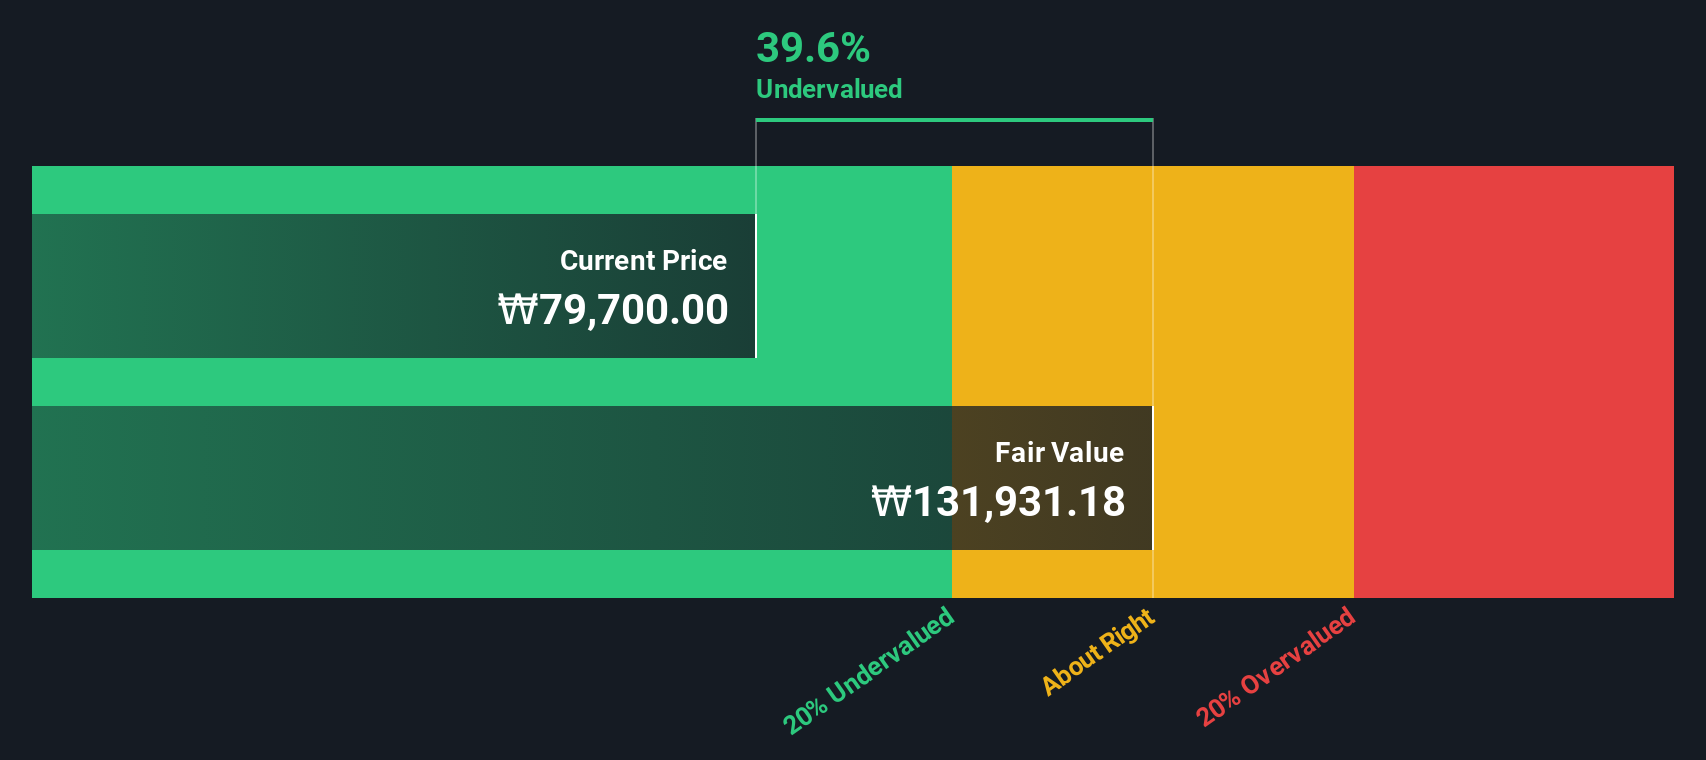
When all these projected cash flows are discounted back to today, the model arrives at an intrinsic value of about ₩239,792 per share. Compared with the current market price, this implies the stock trades at a 55.3% discount to its estimated fair value, which suggests meaningful upside if the cash flow path is broadly accurate.
Result: UNDERVALUED
Our Discounted Cash Flow (DCF) analysis suggests Samsung Electronics is undervalued by 55.3%. Track this in your watchlist or portfolio, or discover 909 more undervalued stocks based on cash flows.
Approach 2: Samsung Electronics Price vs Earnings
For profitable businesses like Samsung Electronics, the Price to Earnings, or PE, ratio is a practical way to gauge what investors are willing to pay for each unit of current earnings. It links today’s share price directly to the company’s profit engine, making it a useful cross check against cash flow based models.
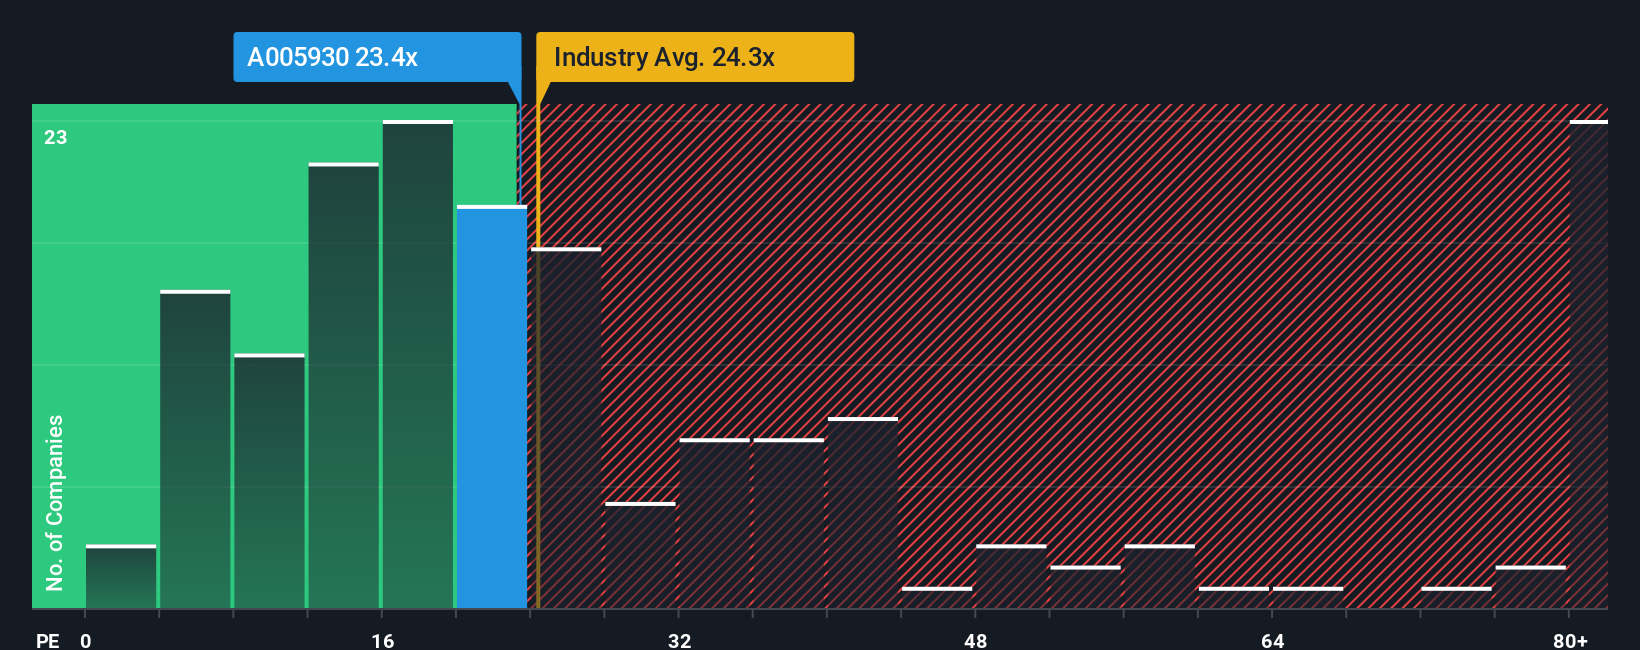
In general, faster growth and lower perceived risk justify a higher PE ratio, while slower or more volatile earnings usually demand a lower one. Samsung currently trades on about 24.6x earnings, which is a premium to both the broader Tech industry average of roughly 22.7x and the peer group average near 15.5x. On these simple comparisons alone, the stock looks relatively expensive.
Simply Wall St’s Fair Ratio framework goes a step further. It estimates what a justified PE should be, given Samsung’s earnings growth profile, profitability, industry, market cap and risk characteristics. On this basis, Samsung’s Fair Ratio is a much higher 45.6x, which suggests that, relative to its fundamentals, the current 24.6x multiple is conservative rather than stretched.
Result: UNDERVALUED
PE ratios tell one story, but what if the real opportunity lies elsewhere? Discover 1446 companies where insiders are betting big on explosive growth.
Upgrade Your Decision Making: Choose your Samsung Electronics Narrative
Earlier we mentioned that there is an even better way to understand valuation, so let us introduce you to Narratives, which are simply your story about Samsung Electronics linked directly to the numbers you believe in, such as future revenue, earnings, margins and ultimately fair value. On Simply Wall St’s Community page, millions of investors use Narratives to connect a company’s qualitative story, for example AI driven chip demand or rising competition and regulation, to a transparent financial forecast and then to an explicit fair value estimate they can compare with today’s price to decide whether to buy, hold or sell. Because Narratives are updated dynamically when new information like earnings, news, or analyst revisions come in, your view of Samsung never goes stale and you can quickly see if your thesis still holds. For instance, one Samsung Narrative might lean on strong AI semiconductor demand and higher margins to justify a fair value closer to ₩129,604, while a more cautious Narrative might stress geopolitical and competitive risks and anchor fair value nearer ₩58,500. Your job is to decide which story and set of assumptions you find more convincing.
Do you think there's more to the story for Samsung Electronics? Head over to our Community to see what others are saying!

This article by Simply Wall St is general in nature. We provide commentary based on historical data and analyst forecasts only using an unbiased methodology and our articles are not intended to be financial advice. It does not constitute a recommendation to buy or sell any stock, and does not take account of your objectives, or your financial situation. We aim to bring you long-term focused analysis driven by fundamental data. Note that our analysis may not factor in the latest price-sensitive company announcements or qualitative material. Simply Wall St has no position in any stocks mentioned.
Have feedback on this article? Concerned about the content? Get in touch with us directly. Alternatively, email editorial-team@simplywallst.com