
- PREMIUM
- LIVE QUOTES
- INSTITUTIONS
 Index Options
 State Street
 CME Group
 Nasdaq
 Cboe
Cboe TradingView
 Wall Street Journal
Heidrick & Struggles Valuation After 2025 Share Price Surge and Pending Cash Buyout Deal
- If you are wondering whether Heidrick & Struggles International is still a smart buy after such a strong run, you are not alone. This is exactly what we are going to unpack here.
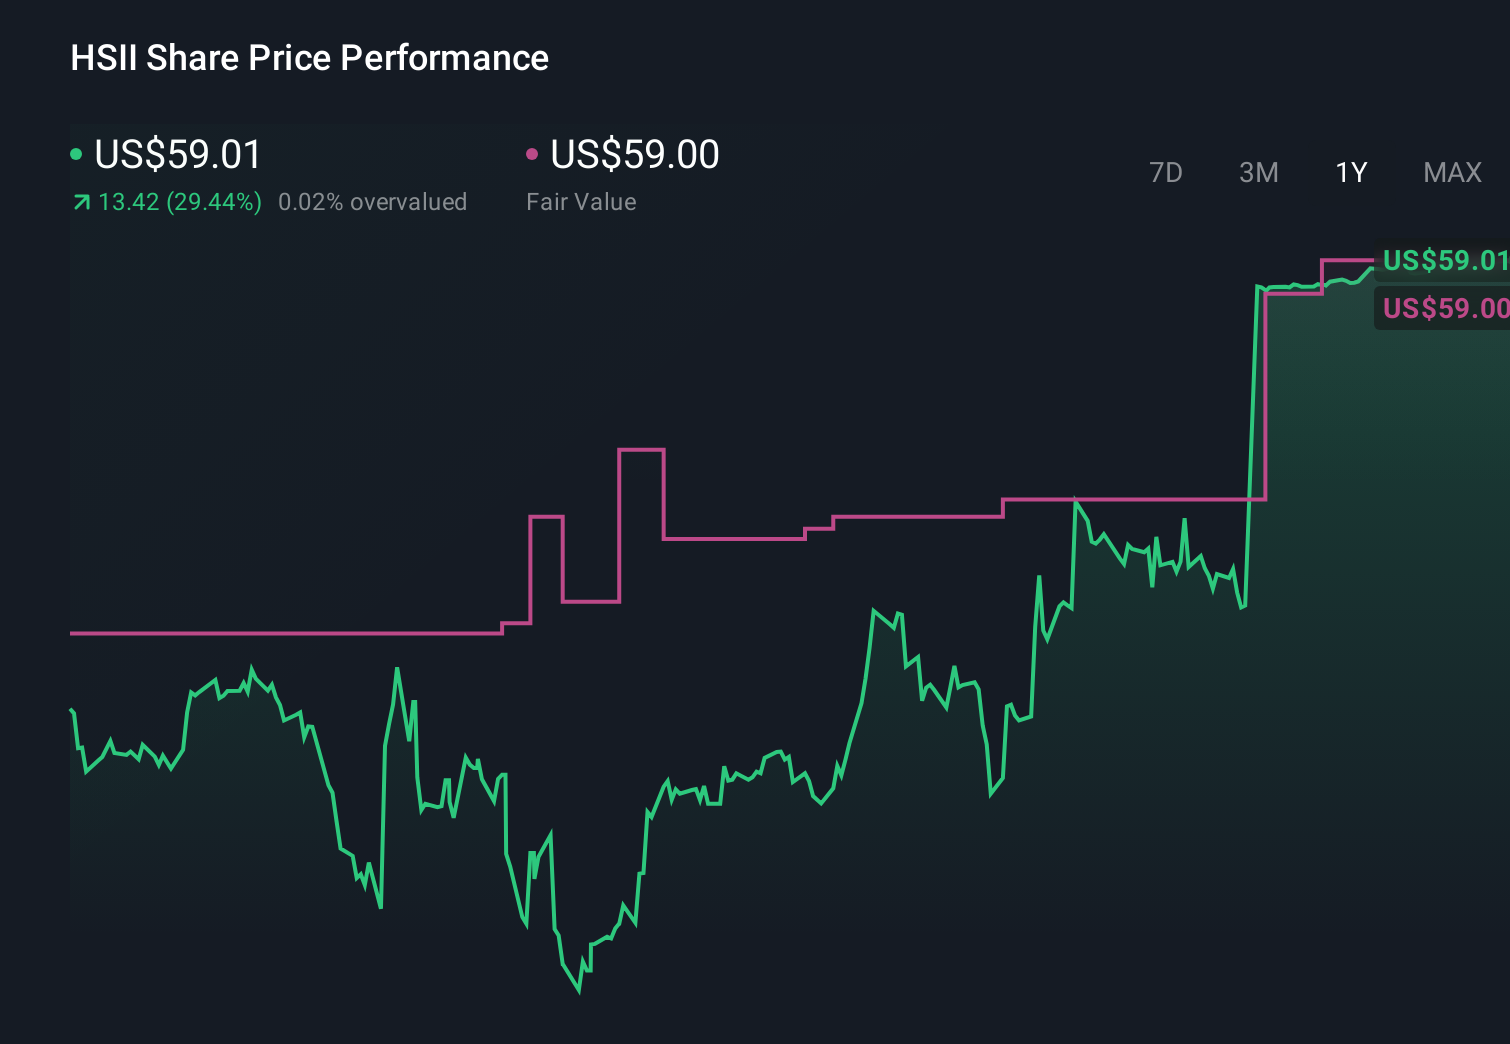
- The stock has climbed 33.9% year to date and is up 30.4% over the last year, while longer term holders have seen gains of 108.8% over 3 years and 122.8% over 5 years, all from a recent close of $59.01.
- Those gains have come as investors have warmed to the company’s positioning in higher value advisory and leadership services, which tend to be more resilient and more profitable than traditional recruitment alone. At the same time, the broader market has been rewarding asset light, cash generative business models, which has helped re-rate the share price.
- Despite that re-rating, Heidrick & Struggles only earns a valuation score of 3/6. Next we will dig into what different valuation methods say about the stock and then finish by looking at a more powerful way to think about value than any single model on its own.
Approach 1: Heidrick & Struggles International Discounted Cash Flow (DCF) Analysis
A Discounted Cash Flow, or DCF, model estimates what a business is worth today by projecting the cash it can generate in the future and discounting those cash flows back to their value in the present.
For Heidrick & Struggles International, the model starts with last twelve months Free Cash Flow of about $127.8 million and then uses analyst forecasts through 2026 plus extrapolated estimates beyond that. Cash flow is expected to ease to roughly $88.0 million by 2026 and then drift slightly lower before gradually growing again over the following years, reflecting a maturing but still resilient cash generative business.
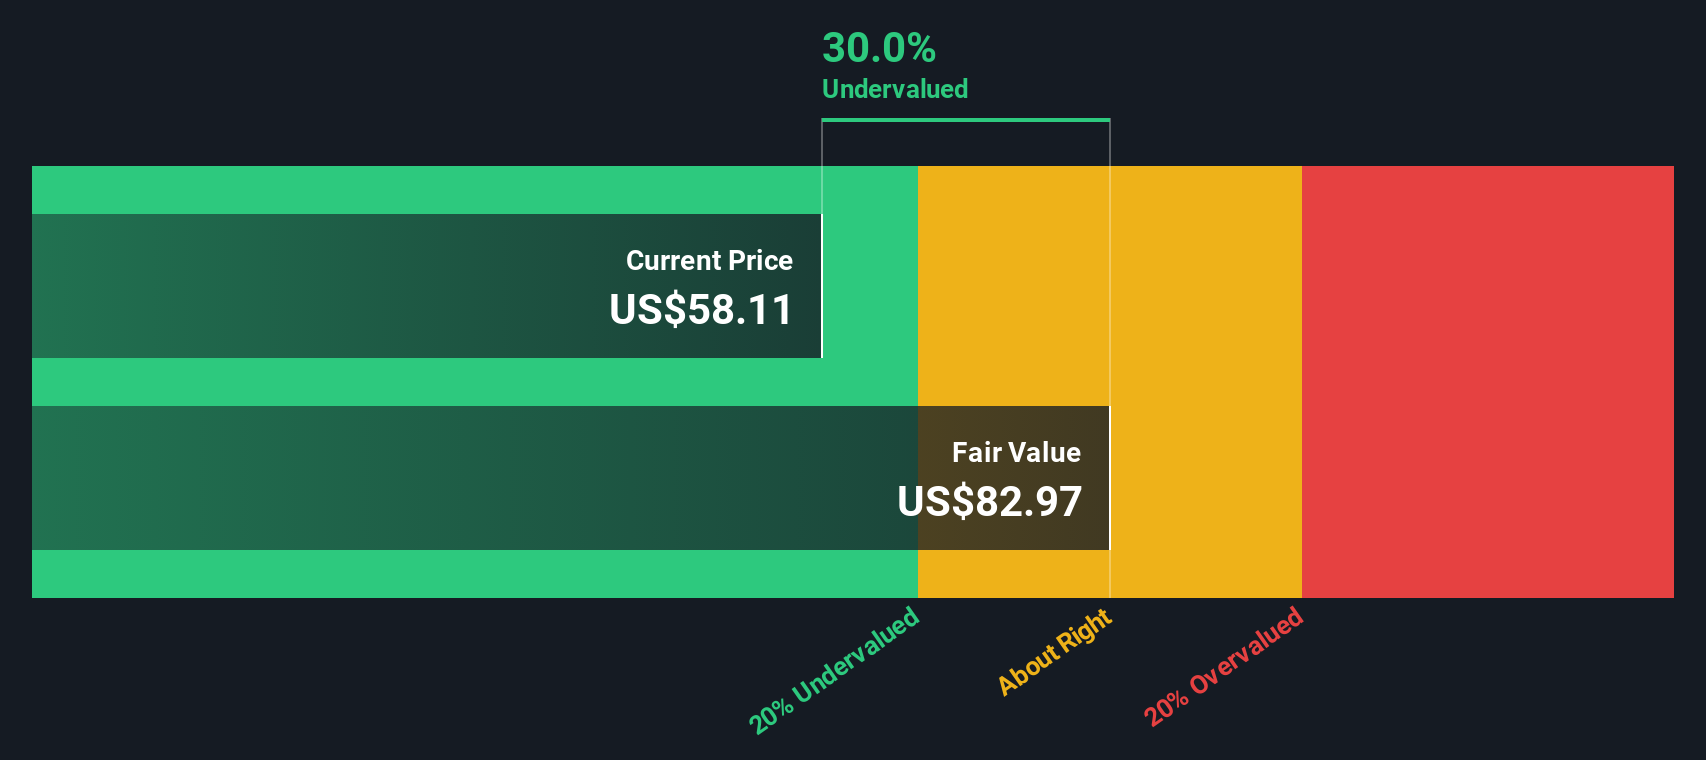
Using a 2 Stage Free Cash Flow to Equity framework, Simply Wall St estimates an intrinsic value of roughly $81.18 per share. Compared to the recent share price of $59.01, this implies the stock trades at about a 27.3% discount to its estimated fair value, which indicates the shares may currently be undervalued if these cash flow projections prove accurate.
Result: UNDERVALUED
Our Discounted Cash Flow (DCF) analysis suggests Heidrick & Struggles International is undervalued by 27.3%. Track this in your watchlist or portfolio, or discover 904 more undervalued stocks based on cash flows.
Approach 2: Heidrick & Struggles International Price vs Earnings
For a consistently profitable company like Heidrick & Struggles International, the price to earnings, or PE, ratio is a practical way to gauge what investors are willing to pay for each dollar of current earnings. In general, higher growth and lower perceived risk justify a higher PE, while slower growth or elevated risk usually call for a lower, more conservative multiple.
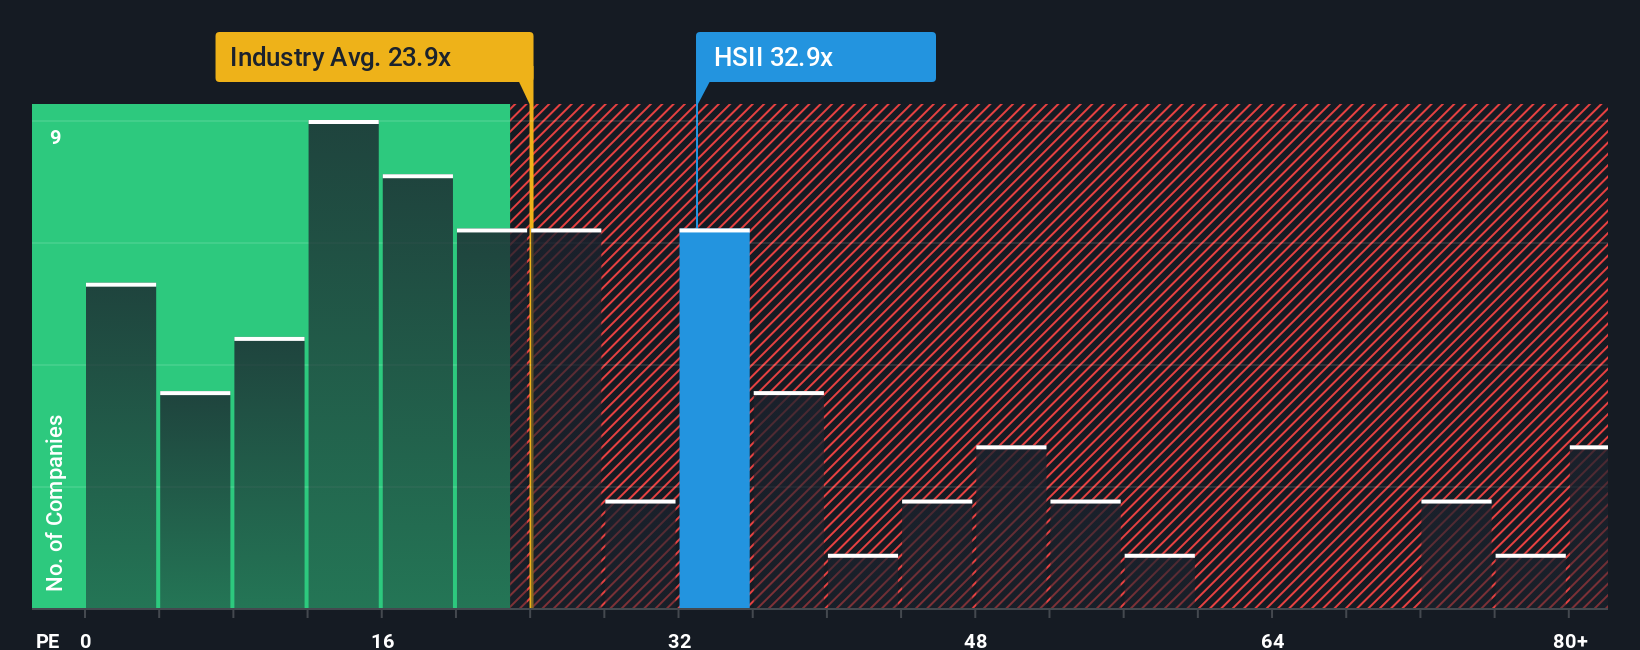
Heidrick & Struggles currently trades on a PE of about 33.1x. That sits above the Professional Services industry average of roughly 24.5x and a little below the peer group average of around 37.2x. This suggests investors are already paying a premium to the sector, but not an extreme one versus close comparables.
Simply Wall St’s Fair Ratio framework estimates a PE of about 25.3x as reasonable for Heidrick & Struggles given its specific blend of earnings growth, profitability, industry, size and risk profile. This company specific measure is more informative than a simple comparison to industry or peers because it adjusts for factors like margins, growth outlook and business risk. Since the current PE of 33.1x is notably higher than the 25.3x Fair Ratio, the shares look somewhat expensive on an earnings multiple basis.
Result: OVERVALUED
PE ratios tell one story, but what if the real opportunity lies elsewhere? Discover 1446 companies where insiders are betting big on explosive growth.
Upgrade Your Decision Making: Choose your Heidrick & Struggles International Narrative
Earlier we mentioned that there is an even better way to understand valuation, so let us introduce you to Narratives, which are simple stories that capture your view of a company and connect that story to a financial forecast and a fair value estimate.
Instead of only looking at static models like DCFs or PE multiples, a Narrative lets you spell out what you think will happen to Heidrick & Struggles International’s revenues, earnings and margins, then automatically turns those assumptions into a fair value you can compare with the current share price to inform your investment decision.
On Simply Wall St’s Community page, used by millions of investors, Narratives are easy to create and track, and they update dynamically as new information arrives, such as earnings results or major news, so your fair value stays aligned with the latest data rather than going stale between reports.
For example, one investor might build an optimistic Narrative that assumes the pending $59 per share cash buyout closes smoothly and anchors fair value at that level. A more cautious investor might focus on execution and regulatory risks, assign a lower fair value closer to the current price, and choose to wait on the sidelines until the deal risk narrows further.
Do you think there's more to the story for Heidrick & Struggles International? Head over to our Community to see what others are saying!
This article by Simply Wall St is general in nature. We provide commentary based on historical data and analyst forecasts only using an unbiased methodology and our articles are not intended to be financial advice. It does not constitute a recommendation to buy or sell any stock, and does not take account of your objectives, or your financial situation. We aim to bring you long-term focused analysis driven by fundamental data. Note that our analysis may not factor in the latest price-sensitive company announcements or qualitative material. Simply Wall St has no position in any stocks mentioned.
Have feedback on this article? Concerned about the content? Get in touch with us directly. Alternatively, email editorial-team@simplywallst.com