
Has Toyota’s 20% Gain in 2025 Already Reflected Its EV and Hybrid Growth Prospects?
- Wondering if Toyota Motor is still good value after its big run up, or if most of the upside is already priced in? You are not alone, and that is exactly what this breakdown aims to unpack.
- The stock has climbed 20.1% over the last year and 125.2% over five years, even though the past month has been a touch softer at -0.5%. A recent 3.7% gain in the last week hints at renewed interest.
- Behind these moves, markets have been digesting a steady stream of news around Toyota's push into electric and hybrid vehicles, partnerships on next generation battery tech, and ongoing efforts to strengthen its global supply chain. Together, these themes are reshaping how investors think about Toyota's growth runway and risk profile.
- On our checklist of six core valuation tests, Toyota scores a 3/6 valuation score, suggesting pockets of undervaluation but not a screaming bargain. Next we will walk through the main valuation methods investors use, then finish with a more holistic way to judge whether the stock is truly mispriced.
Approach 1: Toyota Motor Discounted Cash Flow (DCF) Analysis
A Discounted Cash Flow model estimates what a company is worth by projecting its future cash flows and discounting them back to today, to see what those future yen are worth in present terms.
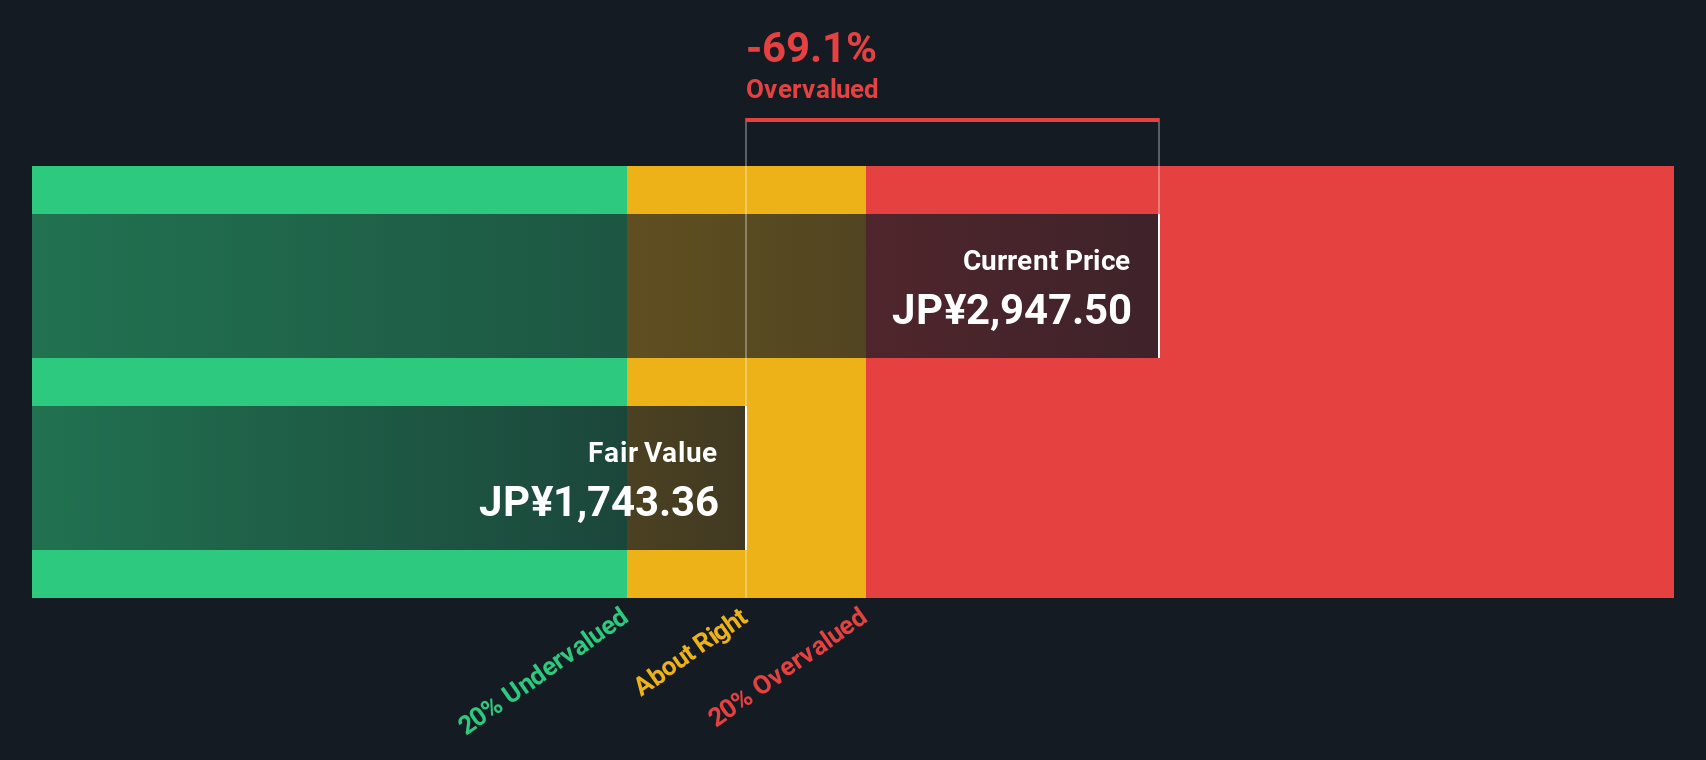
For Toyota Motor, the model used is a 2 Stage Free Cash Flow to Equity approach. While the latest twelve month free cash flow is negative at roughly ¥0.47 trillion, analysts expect a sharp rebound, with free cash flow projected to reach around ¥2.48 trillion by 2030. Between 2026 and 2035, forecast and extrapolated cash flows trend in the ¥1.4 trillion to ¥2.6 trillion range when expressed in today’s money, as Simply Wall St extends analyst estimates beyond the first few years.
Aggregating and discounting these projected cash flows results in an estimated intrinsic value of about ¥1,721 per share. Compared with the current market price, this implies Toyota is roughly 81.0% overvalued on a DCF basis. This suggests investors are paying a substantial premium to the model’s view of fair value.
Result: OVERVALUED
Our Discounted Cash Flow (DCF) analysis suggests Toyota Motor may be overvalued by 81.0%. Discover 906 undervalued stocks or create your own screener to find better value opportunities.
Approach 2: Toyota Motor Price vs Earnings
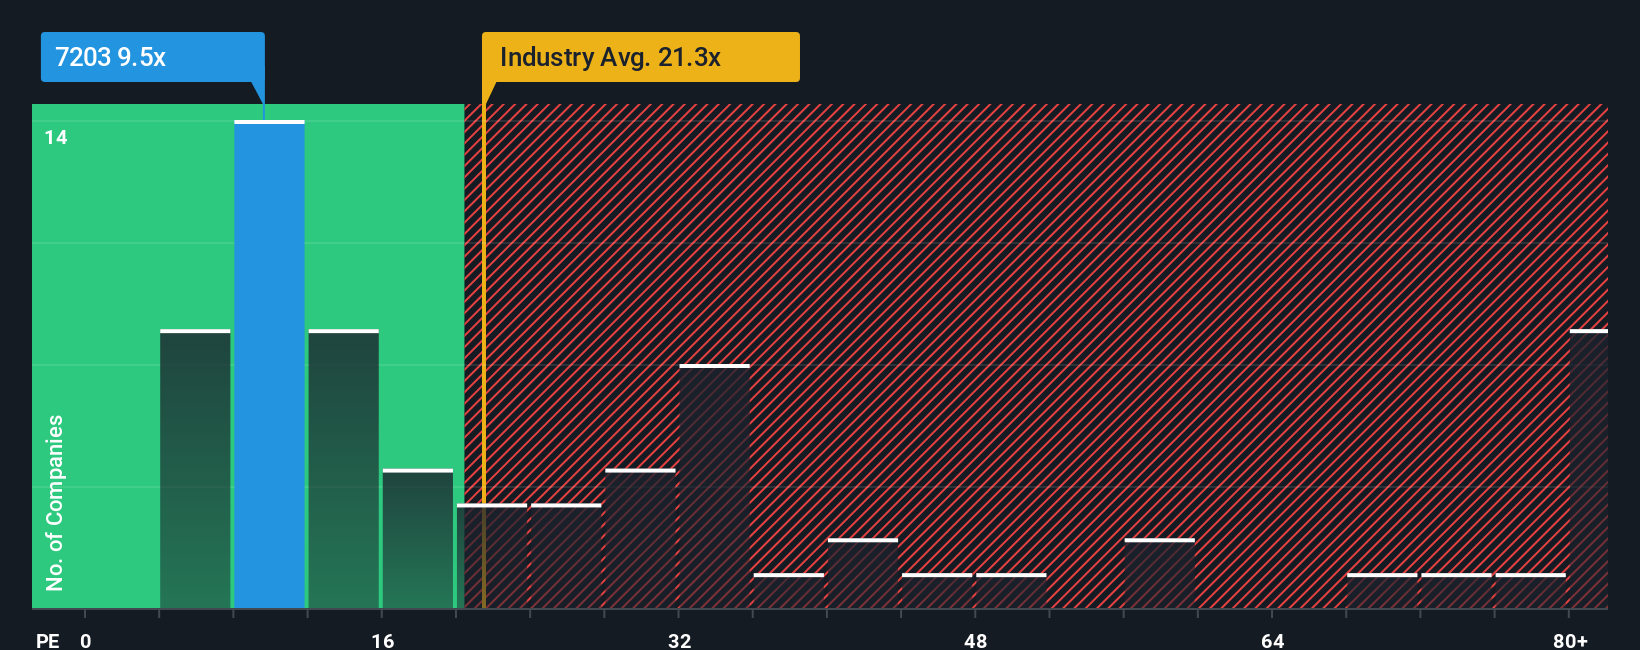
For a mature, profitable business like Toyota, the price to earnings ratio is a practical way to gauge valuation because it links what investors pay today to the profits the company is already generating. In general, faster and more reliable earnings growth, with lower risk, justifies a higher PE ratio, while slower or uncertain growth calls for a lower one.
Toyota currently trades on a PE of about 8.77x, which is below both its Auto industry average of roughly 18.49x and the peer group average of around 10.41x. On the surface, that discount might suggest the market is cautious about Toyota’s growth prospects or risks. However, Simply Wall St’s Fair Ratio framework goes a step further by estimating what PE Toyota should command, given its specific earnings growth outlook, profitability, industry positioning, market cap and risk profile.
On this basis, Toyota’s Fair Ratio is estimated at 16.48x, well above its current 8.77x. Because this Fair Ratio already adjusts for growth and risk, it provides a more tailored benchmark than broad peer or industry comparisons, and it implies the market is undervaluing Toyota’s earnings power.
Result: UNDERVALUED
PE ratios tell one story, but what if the real opportunity lies elsewhere? Discover 1448 companies where insiders are betting big on explosive growth.
Upgrade Your Decision Making: Choose your Toyota Motor Narrative
Earlier we mentioned that there is an even better way to understand valuation, so let us introduce Narratives, a simple framework on Simply Wall St’s Community page where you connect a clear story about Toyota Motor, your assumptions for its future revenue, earnings and margins, and the fair value those assumptions imply. You can then compare that fair value to today’s price to decide whether to buy, hold or sell, with the whole view updating dynamically as fresh news or earnings arrive. For example, one investor might build a bullish Toyota Narrative around sustained 3% plus annual revenue growth, resilient margins near 8% and a future PE above 14x that supports a fair value near ¥3,416, while another might focus on litigation risks, margin compression toward 7% and weaker earnings that justify a more cautious fair value closer to ¥2,400. Both perspectives can coexist transparently on the platform as different, data linked stories behind the same stock price.
Do you think there's more to the story for Toyota Motor? Head over to our Community to see what others are saying!

This article by Simply Wall St is general in nature. We provide commentary based on historical data and analyst forecasts only using an unbiased methodology and our articles are not intended to be financial advice. It does not constitute a recommendation to buy or sell any stock, and does not take account of your objectives, or your financial situation. We aim to bring you long-term focused analysis driven by fundamental data. Note that our analysis may not factor in the latest price-sensitive company announcements or qualitative material. Simply Wall St has no position in any stocks mentioned.
Have feedback on this article? Concerned about the content? Get in touch with us directly. Alternatively, email editorial-team@simplywallst.com