
- PREMIUM
- LIVE QUOTES
- INSTITUTIONS
 Index Options
 State Street
 CME Group
 Nasdaq
 Cboe
Cboe TradingView
 Wall Street Journal
Telix Pharmaceuticals (ASX:TLX) Valuation Check as ProstACT Global Phase 3 Trial Progresses to Part 2
Telix Pharmaceuticals (ASX:TLX) has dosed the first patient in Part 2 of its ProstACT Global Phase 3 trial for TLX591 in advanced prostate cancer, a key step that can reshape future value expectations.
See our latest analysis for Telix Pharmaceuticals.
This milestone comes after a tough stretch for investors, with the share price down sharply on a year to date basis even as the 3-year total shareholder return of 97.18 percent still points to strong long term wealth creation. This suggests sentiment may be resetting around Telix’s maturing pipeline rather than the story being broken.
If Telix’s progress in prostate cancer has caught your attention, it is worth also exploring other innovative healthcare names using our healthcare stocks as a starting point for fresh ideas.
With the share price languishing despite solid revenue and profit growth and a large discount to analyst targets, is Telix an underappreciated radiopharma leader, or is the market already bracing for slower growth ahead?
Price-to-Sales of 4.7x: Is it justified?
On a price-to-sales basis, Telix looks inexpensive, with its 4.7x multiple sitting well below both peers and the wider Australian biotech space despite the A$14 last close price.
The price-to-sales ratio compares the company’s market value to its revenue. This can be a useful lens for a commercial stage biotech where profits can be noisy as pipelines scale up. For Telix, this multiple suggests investors are paying a relatively modest premium for each dollar of current sales, even as the business is already generating revenue and is forecast to grow earnings strongly.
Compared to the Australian Biotechs industry average of 14.6x and a peer average of 21.8x, Telix’s 4.7x stands out as markedly lower, implying the market may be assigning a discount to its growth and pipeline potential. This is further underlined by our SWS fair price to sales ratio estimate of 5.9x, a level the market could gravitate toward if confidence in Telix’s long term earnings profile continues to build.
Explore the SWS fair ratio for Telix Pharmaceuticals
Result: Price-to-Sales of 4.7x (UNDERVALUED)
However, investors still face clinical trial setbacks or slower than expected adoption of Telix’s radiopharmaceuticals, which could quickly reset today’s seemingly attractive valuation.
Find out about the key risks to this Telix Pharmaceuticals narrative.
Another take from our DCF model
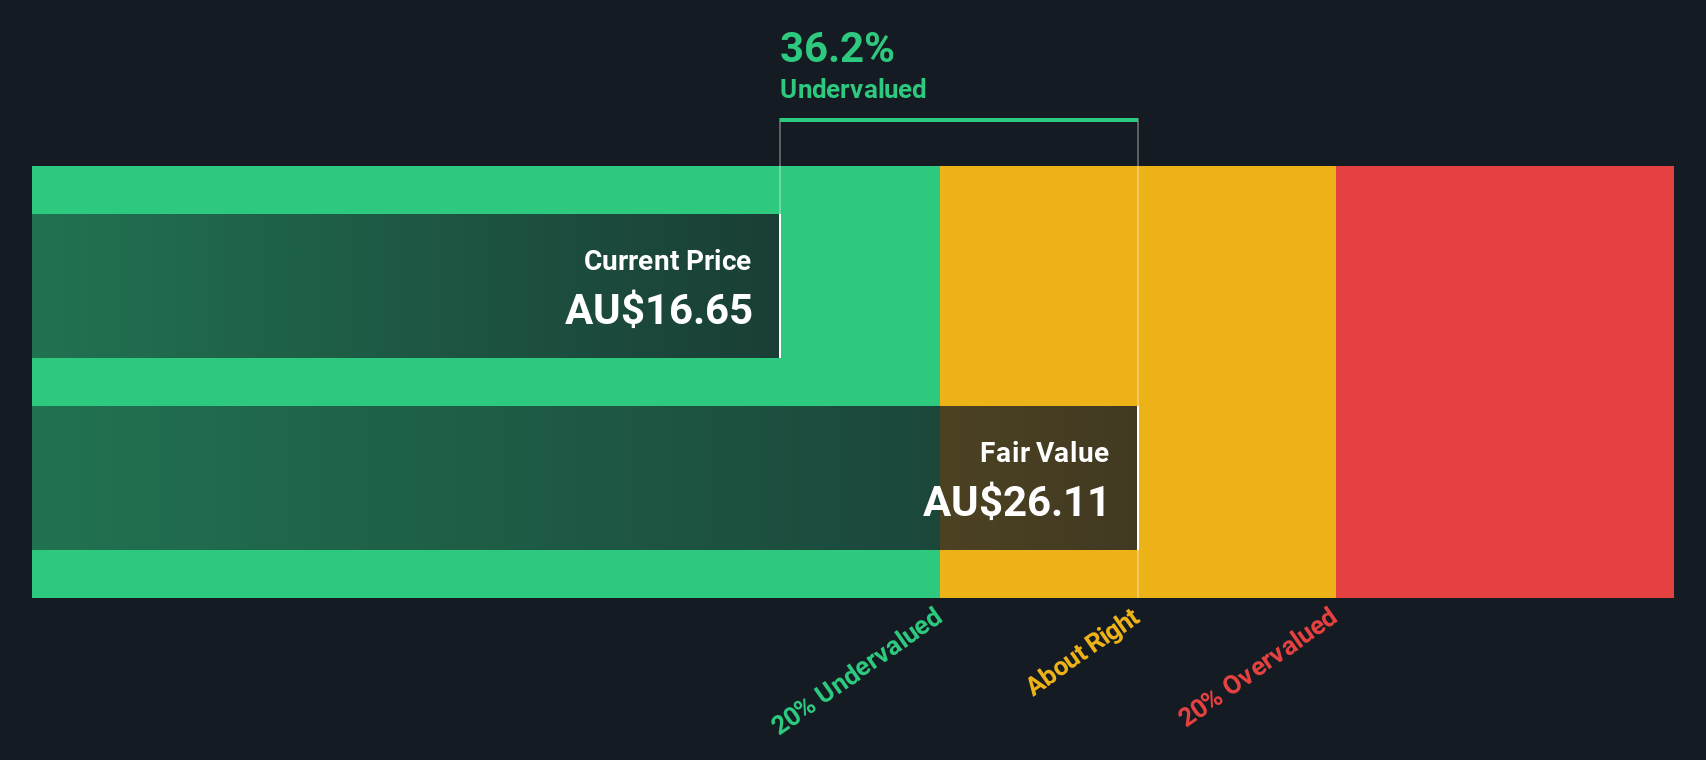
Our DCF model tells a similar story but in even starker terms, suggesting Telix’s shares are trading around 51 percent below an estimated fair value of about A$28.77. If both sales based and cash flow based lenses point to upside, are expectations simply too low, or are risks underappreciated?
Look into how the SWS DCF model arrives at its fair value.
Simply Wall St performs a discounted cash flow (DCF) on every stock in the world every day (check out Telix Pharmaceuticals for example). We show the entire calculation in full. You can track the result in your watchlist or portfolio and be alerted when this changes, or use our stock screener to discover 905 undervalued stocks based on their cash flows. If you save a screener we even alert you when new companies match - so you never miss a potential opportunity.
Build Your Own Telix Pharmaceuticals Narrative
If you see things differently or want to dig into the numbers yourself, you can quickly build your own view in just a few minutes, Do it your way.
A great starting point for your Telix Pharmaceuticals research is our analysis highlighting 3 key rewards and 3 important warning signs that could impact your investment decision.
Looking for more investment ideas?
Before you move on, lock in a few high potential watchlist candidates using the Simply Wall St Screener, so you are not chasing them after they run.
- Capture fast moving, low priced opportunities by scanning these 3598 penny stocks with strong financials that already show solid financial strength instead of speculation alone.
- Capitalize on the AI shift by targeting these 26 AI penny stocks positioned at the heart of machine learning, automation, and data driven platforms.
- Secure potential bargains with these 905 undervalued stocks based on cash flows that current cash flows suggest the market has not fully appreciated yet.
This article by Simply Wall St is general in nature. We provide commentary based on historical data and analyst forecasts only using an unbiased methodology and our articles are not intended to be financial advice. It does not constitute a recommendation to buy or sell any stock, and does not take account of your objectives, or your financial situation. We aim to bring you long-term focused analysis driven by fundamental data. Note that our analysis may not factor in the latest price-sensitive company announcements or qualitative material. Simply Wall St has no position in any stocks mentioned.
Have feedback on this article? Concerned about the content? Get in touch with us directly. Alternatively, email editorial-team@simplywallst.com