
- PREMIUM
- LIVE QUOTES
- INSTITUTION
 Index Options
 State Street
 CME Group
 Nasdaq
 Cboe
Cboe TradingView
 Wall Street Journal
Assessing American Express After Strong 2025 Gains and Expanded Premium Card Perks
- Wondering if American Express is still a smart buy after its long run, or if most of the upside is already priced in? Let us unpack what the current share price might really be saying about its value.
- Despite some near term noise, with the stock up 0.9% over the last week but down 1.3% over the past month, American Express has still delivered a strong 21.9% gain year to date and a 225.0% return over five years.
- Recent headlines have focused on American Express expanding premium card perks and deepening partnerships in travel and lifestyle. These moves reinforce its strategy of targeting higher spending, higher loyalty customers. At the same time, ongoing discussions around consumer credit health and interest rate expectations keep reshaping how investors view the company’s risk and growth profile.
- Right now, American Express only scores 1/6 on our valuation checks, which suggests the stock does not look broadly undervalued on traditional metrics, but that hardly tells the full story. Next, we will walk through the key valuation approaches behind that score, then finish with a more complete way to think about what this business is really worth over the long term.
American Express scores just 1/6 on our valuation checks. See what other red flags we found in the full valuation breakdown.
Approach 1: American Express Excess Returns Analysis
The Excess Returns model estimates what American Express is worth by comparing how much profit it can generate on shareholders’ equity versus the return investors demand. When a company earns more on its equity than this required return, it creates excess value for shareholders.
For American Express, the starting point is a Book Value of $47.05 per share and a Stable Book Value projection of $50.82 per share, based on future book value estimates from 9 analysts. Its Stable EPS is estimated at $18.40 per share, derived from forward looking return on equity forecasts from 13 analysts.
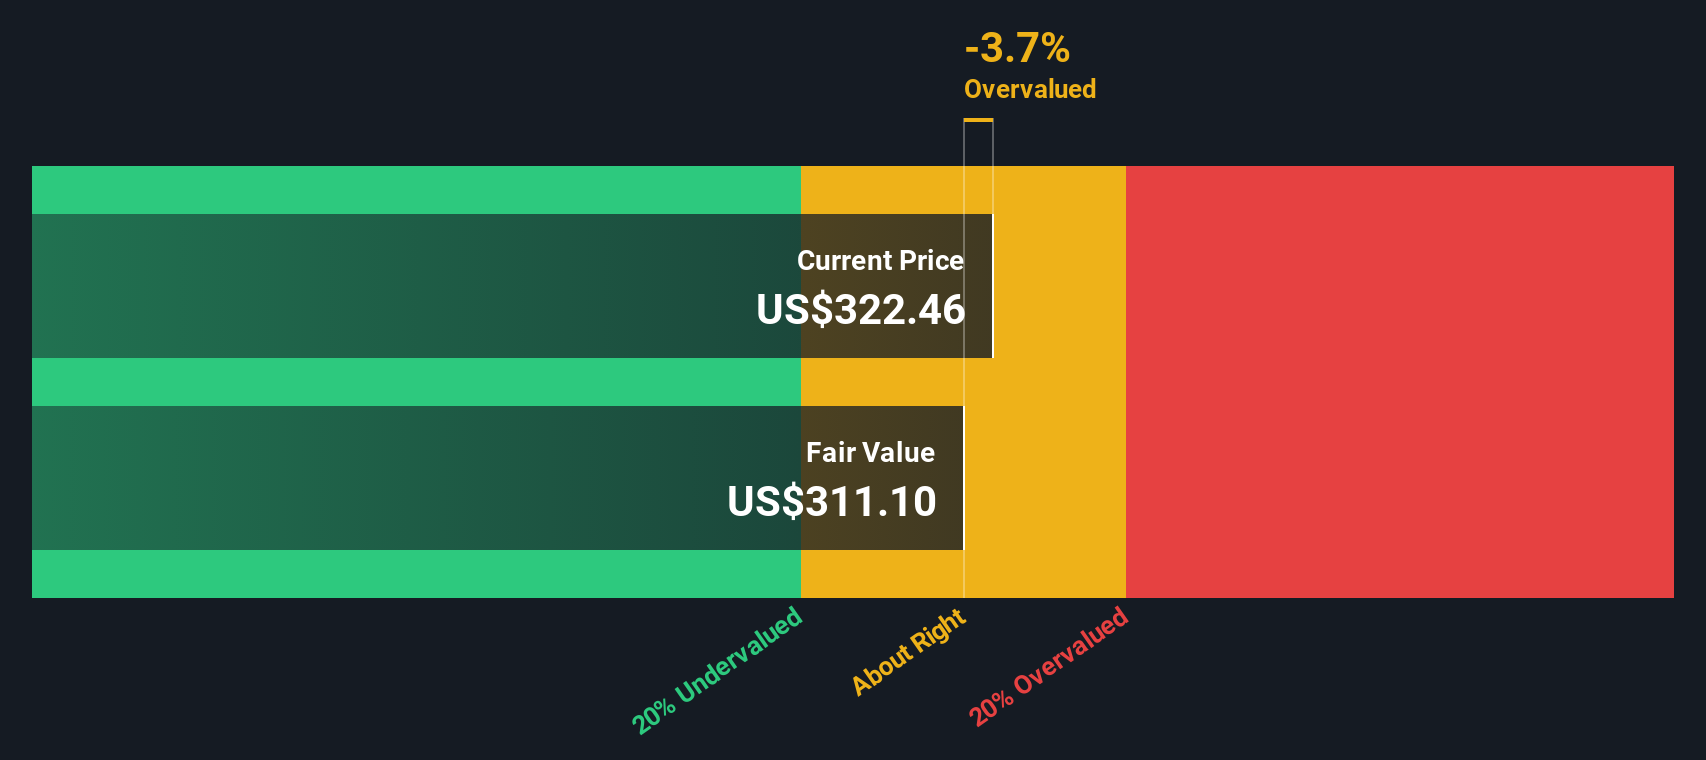
With a Cost of Equity of $4.27 per share and an Excess Return of $14.13 per share, the model implies American Express can continue to earn well above its required return, supported by an average Return on Equity of 36.20%. Feeding these inputs into the Excess Returns framework results in an intrinsic value that is about 11.7% below the current share price. This suggests the stock is modestly overvalued on this basis.
Result: OVERVALUED
Our Excess Returns analysis suggests American Express may be overvalued by 11.7%. Discover 901 undervalued stocks or create your own screener to find better value opportunities.
Approach 2: American Express Price vs Earnings
For a profitable business like American Express, the price to earnings, or PE, ratio is a useful way to gauge how much investors are willing to pay for each dollar of current earnings. In general, companies with stronger, more reliable growth and lower perceived risk can justify a higher PE, while slower growth or higher uncertainty should translate into a lower, more conservative multiple.
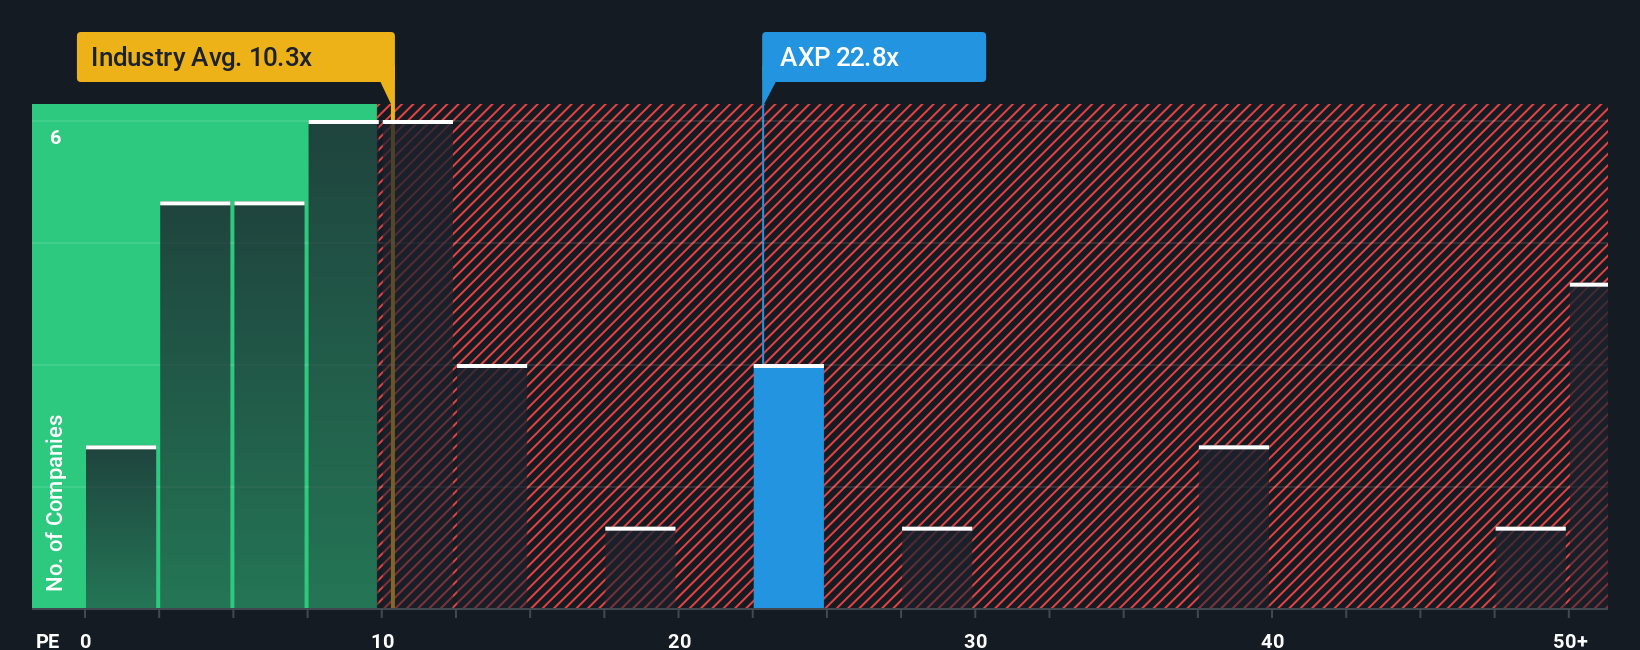
American Express currently trades on a PE of 24.1x. That is well above the broader Consumer Finance industry average of around 8.8x, but slightly below the 25.2x average of its closer peers, which tend to be higher quality and faster growing. To move beyond simple comparisons, Simply Wall St estimates a proprietary Fair Ratio of 19.7x for American Express, which reflects its earnings growth outlook, profitability, industry positioning, size and specific risk factors. This Fair Ratio is more tailored than peer or industry averages because it adjusts for what actually drives a justifiable multiple rather than assuming all financials should trade alike.
On this basis, the current PE of 24.1x sits meaningfully above the 19.7x Fair Ratio, pointing to a stock that looks somewhat expensive relative to its fundamentals.
Result: OVERVALUED
PE ratios tell one story, but what if the real opportunity lies elsewhere? Discover 1447 companies where insiders are betting big on explosive growth.
Upgrade Your Decision Making: Choose your American Express Narrative
Earlier we mentioned that there is an even better way to understand valuation, so let us introduce you to Narratives, a simple way to connect your view of American Express’s future with the numbers behind it. A Narrative is your story about the company, where you spell out what you think will happen to its revenue, earnings and margins, then link that story to a financial forecast and a Fair Value estimate. On Simply Wall St, millions of investors use Narratives on the Community page as an easy, accessible tool to decide when to buy or sell, by comparing their Fair Value to the current market price and seeing if the gap suggests upside or downside. Narratives are dynamic; they automatically update as fresh information like earnings releases, news or guidance changes comes in, so your view stays current without extra work. For example, one Narrative on American Express might see its Fair Value closer to the bullish 366 dollars per share based on faster international expansion, while another might lean toward the more cautious 230 dollars if it expects slower travel spending and tighter margins.
For American Express, we will make it really easy for you with previews of two leading American Express Narratives:
Fair Value: $366.63
Implied Undervaluation vs Last Close: -1.0%
Forecast Revenue Growth: 11.1%
- Leans into surging demand from Millennial and Gen Z customers, plus international expansion, to drive stronger transaction growth and fee income.
- Assumes tech and AI investments, premium product refreshes, and integrated SME and B2B solutions will support higher margins and resilient, diversified earnings.
- Targets a bullish 2028 outcome with higher earnings, a modestly higher PE than today, and a price near the top of the analyst range, contingent on robust execution and manageable disruption from digital payment alternatives and regulation.
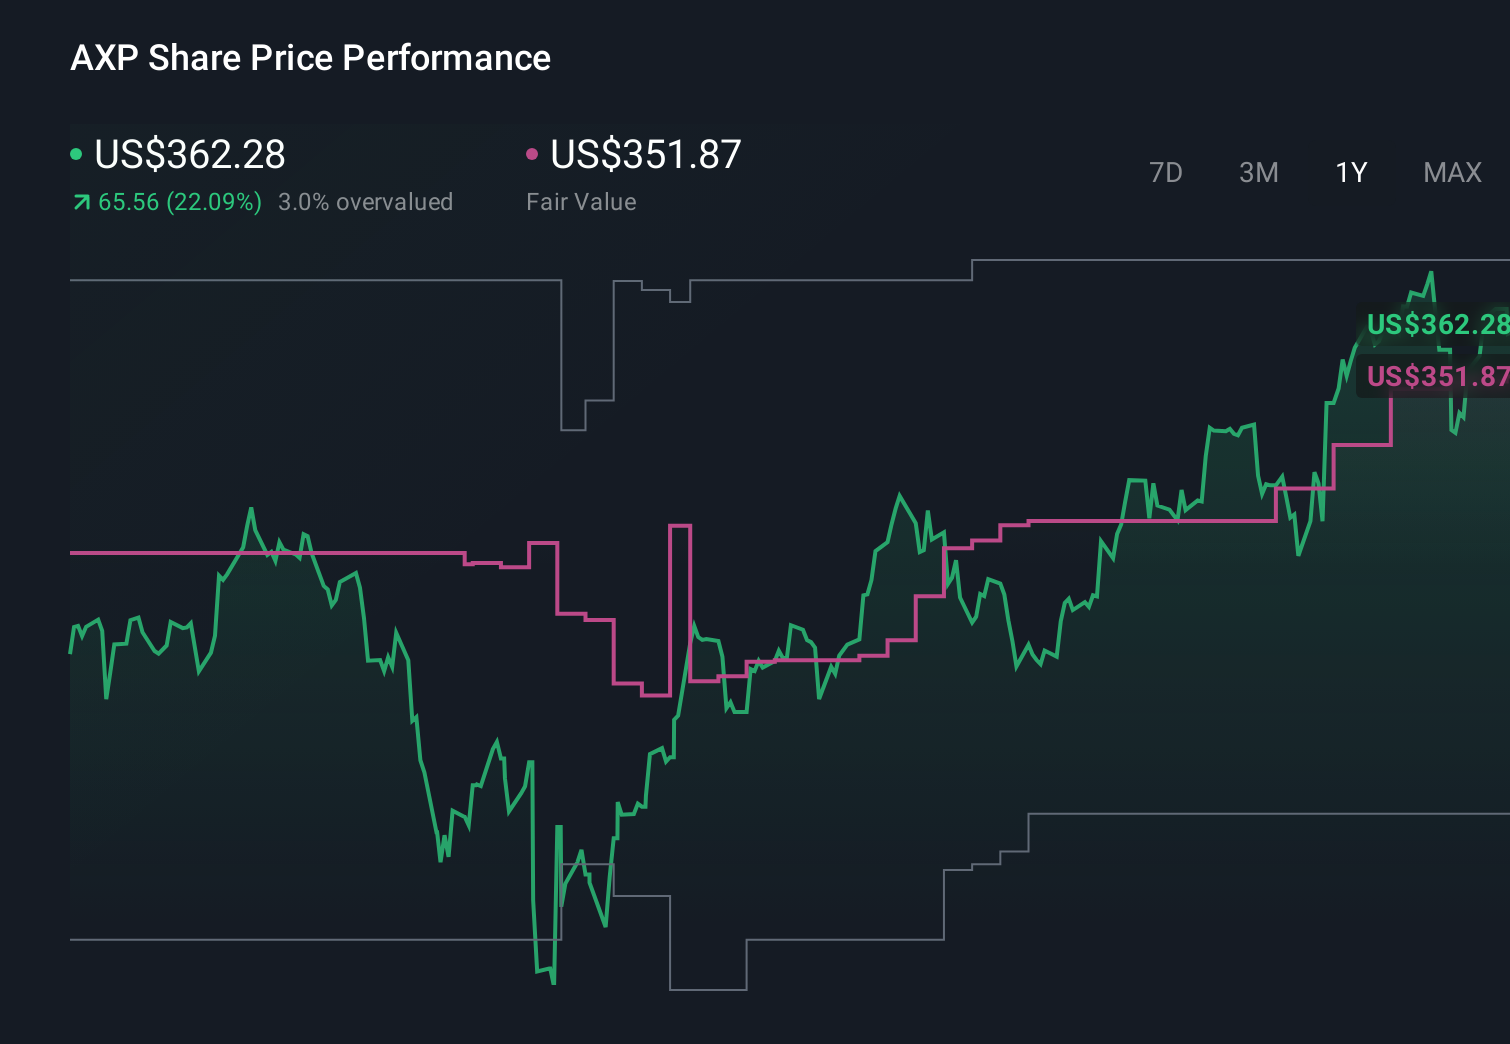
Fair Value: $351.87
Implied Overvaluation vs Last Close: 3.4%
Forecast Revenue Growth: 10.3%
- Sees solid but more measured growth driven by premium cardholders, younger affluent customers, and international expansion, with earnings broadly tracking current execution strength.
- Assumes disciplined credit and capital management underpin stable margins and ongoing buybacks, keeping EPS growth healthy but not explosive.
- Highlights risks from intensifying premium competition, shifting consumer payment habits, and potential disruption from new low cost payment rails, leading to a view that the stock is close to fairly valued at current levels.
Do you think there's more to the story for American Express? Head over to our Community to see what others are saying!
This article by Simply Wall St is general in nature. We provide commentary based on historical data and analyst forecasts only using an unbiased methodology and our articles are not intended to be financial advice. It does not constitute a recommendation to buy or sell any stock, and does not take account of your objectives, or your financial situation. We aim to bring you long-term focused analysis driven by fundamental data. Note that our analysis may not factor in the latest price-sensitive company announcements or qualitative material. Simply Wall St has no position in any stocks mentioned.
Have feedback on this article? Concerned about the content? Get in touch with us directly. Alternatively, email editorial-team@simplywallst.com