
- PREMIUM
- LIVE QUOTES
- INSTITUTION
 Index Options
 State Street
 CME Group
 Nasdaq
 Cboe
Cboe TradingView
 Wall Street Journal
Has Abercrombie’s 40% Surge Left Further Upside in 2025?
- Wondering if Abercrombie & Fitch is still a bargain after its big run, or if the easy money has already been made? You are not alone; this stock has been firmly on value hunters' radars.
- Despite slipping about 0.2% over the last week, the share price has surged roughly 39.7% in the past month. Longer term returns are mixed, with a 332.5% gain over 3 years but a 27.7% drop over the last year.
- Recently, the market has been reacting to Abercrombie & Fitch's ongoing brand reinvention and stronger positioning in the premium casual wear segment. Investor sentiment has also been influenced by broader retail sector optimism and shifting expectations around consumer spending resilience.
- On our valuation checks, Abercrombie & Fitch scores a 4/6 valuation score, suggesting the stock screens as undervalued on several key metrics, but not all. Next, we will unpack how it looks under different valuation lenses, and later we will explore a more holistic way to think about its true worth beyond just the numbers.
Find out why Abercrombie & Fitch's -27.7% return over the last year is lagging behind its peers.
Approach 1: Abercrombie & Fitch Discounted Cash Flow (DCF) Analysis
A Discounted Cash Flow model takes the cash Abercrombie & Fitch is expected to generate in the future and discounts those projections back to today, to estimate what the business is worth right now.
Abercrombie & Fitch generated about $410.4 million in free cash flow over the last twelve months, and analysts expect this to stay robust, with projections of roughly $434.1 million in 2026 and $481.0 million in 2027. Further out, Simply Wall St extrapolates the company producing around $324.4 million of free cash flow in 2035, as growth gradually normalizes.
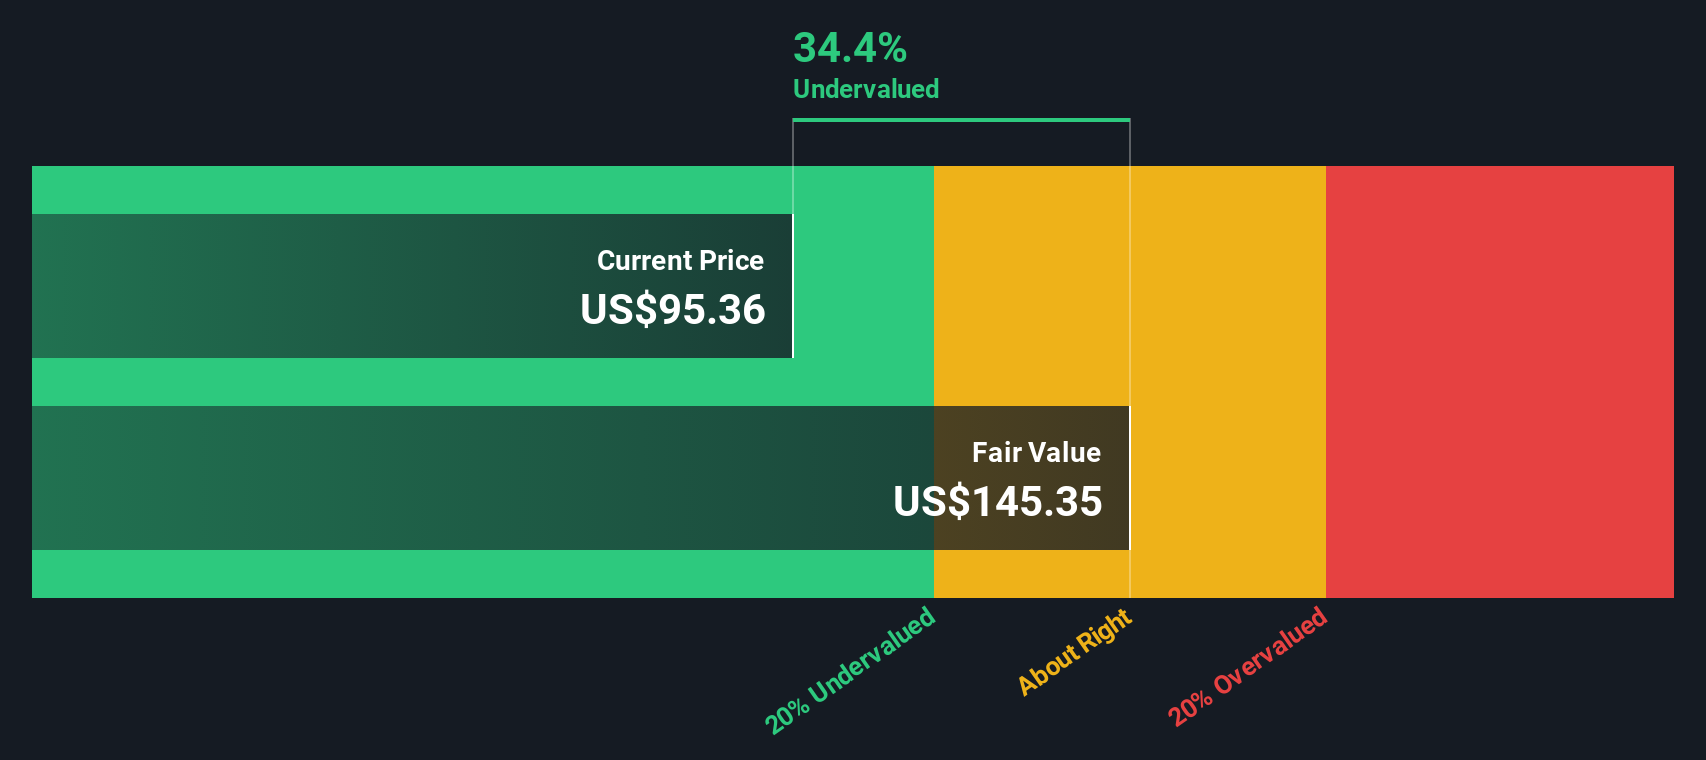
Using a 2 Stage Free Cash Flow to Equity model, these future cash flows are discounted to today and combined to give an estimated intrinsic value of about $101.87 per share. Compared to the current share price, this suggests the stock is roughly 1.9% undervalued, which is only a modest gap rather than a deep discount.
Result: ABOUT RIGHT
Abercrombie & Fitch is fairly valued according to our Discounted Cash Flow (DCF), but this can change at a moment's notice. Track the value in your watchlist or portfolio and be alerted on when to act.
Approach 2: Abercrombie & Fitch Price vs Earnings
For consistently profitable companies like Abercrombie & Fitch, the price to earnings, or PE, ratio is a straightforward way to judge whether investors are paying a reasonable price for each dollar of current profits. What counts as a normal PE depends largely on how fast earnings are expected to grow and how risky those earnings are, with higher growth and lower perceived risk typically justifying a higher multiple.
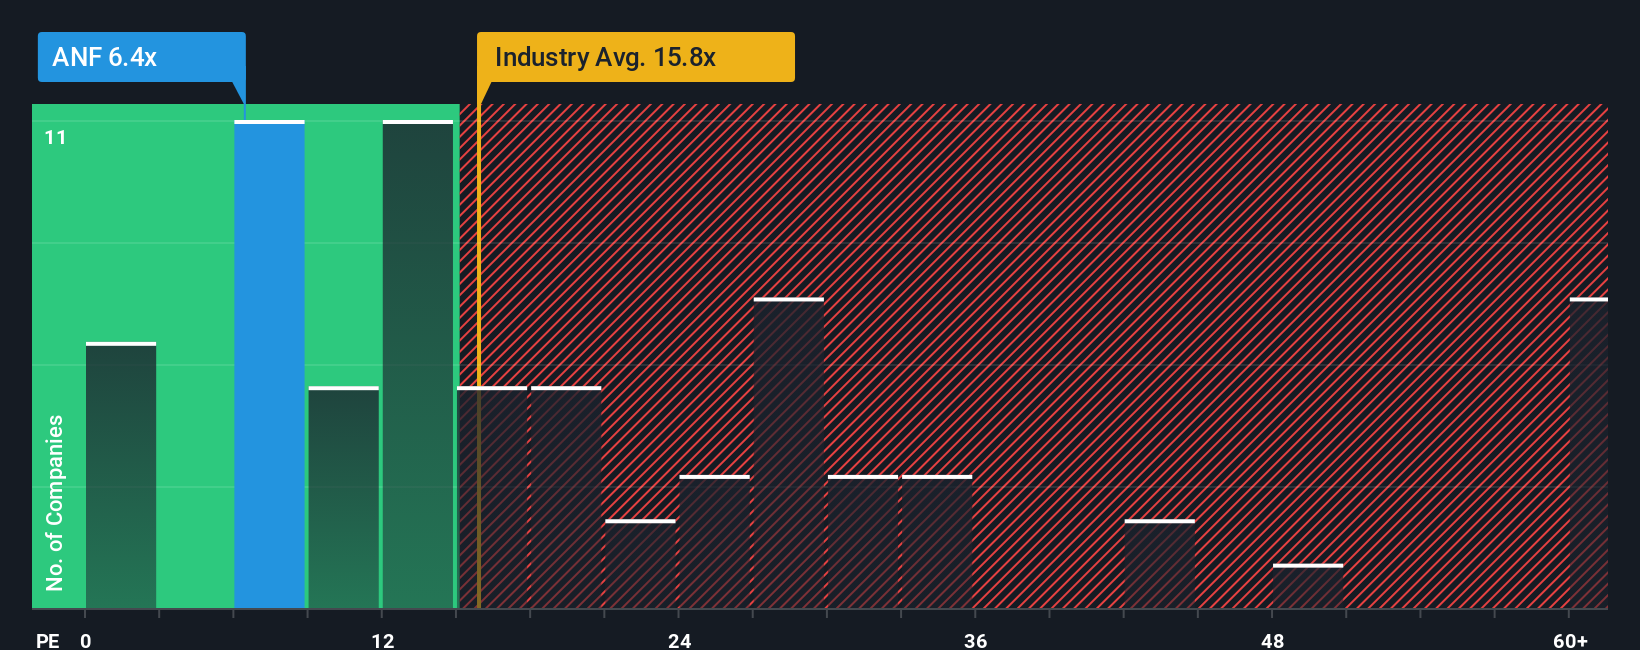
Abercrombie & Fitch currently trades on a PE of about 8.8x, which is well below both the Specialty Retail industry average of roughly 19.4x and the broader peer group average of about 21.9x. Simply Wall St also calculates a proprietary Fair Ratio of 13.5x for Abercrombie & Fitch. This Fair Ratio is designed to reflect the PE you might expect given the company’s earnings growth outlook, profitability, risk profile, industry characteristics and market cap.
Because it blends these company specific fundamentals rather than relying on broad group averages, the Fair Ratio can be a more targeted benchmark than simple peer or industry comparisons. Measured against this 13.5x Fair Ratio, the current 8.8x multiple suggests the shares still trade at a meaningful discount.
Result: UNDERVALUED
PE ratios tell one story, but what if the real opportunity lies elsewhere? Discover 1450 companies where insiders are betting big on explosive growth.
Upgrade Your Decision Making: Choose your Abercrombie & Fitch Narrative
Earlier we mentioned that there is an even better way to understand valuation, so let us introduce you to Narratives, where you tell the story behind the numbers by setting your own assumptions for Abercrombie & Fitch’s future revenue, earnings and margins, then link that story to a financial forecast and, ultimately, a Fair Value estimate. On Simply Wall St’s Community page, Narratives are an easy, visual tool used by millions of investors to compare that Fair Value to today’s share price and decide whether a stock looks like a buy, a hold or a sell. Because they update dynamically as new information such as earnings, guidance or news comes in, your view of value evolves in real time instead of staying static. For example, one Abercrombie & Fitch Narrative might take a cautious view similar to the lowest analyst target of about $84 per share, focusing on tariff headwinds and margin pressure. Another Narrative might lean toward the most optimistic view near $145 per share, assuming that brand momentum, international expansion and ongoing buybacks will keep compounding value over the next several years.
Do you think there's more to the story for Abercrombie & Fitch? Head over to our Community to see what others are saying!

This article by Simply Wall St is general in nature. We provide commentary based on historical data and analyst forecasts only using an unbiased methodology and our articles are not intended to be financial advice. It does not constitute a recommendation to buy or sell any stock, and does not take account of your objectives, or your financial situation. We aim to bring you long-term focused analysis driven by fundamental data. Note that our analysis may not factor in the latest price-sensitive company announcements or qualitative material. Simply Wall St has no position in any stocks mentioned.
Have feedback on this article? Concerned about the content? Get in touch with us directly. Alternatively, email editorial-team@simplywallst.com