
- PREMIUM
- LIVE QUOTES
- INSTITUTION
 Index Options
 State Street
 CME Group
 Nasdaq
 Cboe
Cboe TradingView
 Wall Street Journal
Is It Too Late To Consider KLA After Its 92.5% Surge In 2025?
- If you have been wondering whether KLA’s soaring share price still offers value, you are not alone. This breakdown is designed to help you decide if now is a smart entry point or a time to be cautious.
- The stock has climbed 92.5% year to date and 90.5% over the last year, building on multi-year gains of 210.7% over 3 years and 396.4% over 5 years that have significantly influenced how the market prices its future.
- These moves have been supported by KLA’s established role in semiconductor process control, as chipmakers increase spending on advanced nodes and capacity to meet long-term AI and data center demand. At the same time, industry headlines about cyclical swings in wafer fab equipment and geopolitical tensions around chip supply chains continue to influence how investors view the risk side of that growth story.
- Despite that optimism, KLA only scores 1/6 on our valuation checks. This suggests the market might already be pricing in a lot of positive expectations and raises an important question about whether traditional valuation methods are sufficient, or if there is a better way to judge what the stock is really worth by the end of this article.
KLA scores just 1/6 on our valuation checks. See what other red flags we found in the full valuation breakdown.
Approach 1: KLA Discounted Cash Flow (DCF) Analysis
A Discounted Cash Flow, or DCF, model estimates what a company is worth today by projecting its future cash flows and then discounting those back into today's dollars. For KLA, the model used is a 2 Stage Free Cash Flow to Equity approach built on cash flow projections.
KLA generated roughly $3.9 billion in free cash flow over the last twelve months, in $. Analyst and internal projections see this rising steadily, with free cash flow expected to reach about $6.7 billion by 2030 and continuing to grow through 2035. The projections up to 2030 are based on analyst estimates, while the later years are extrapolated to reflect a slowing but still positive growth path.
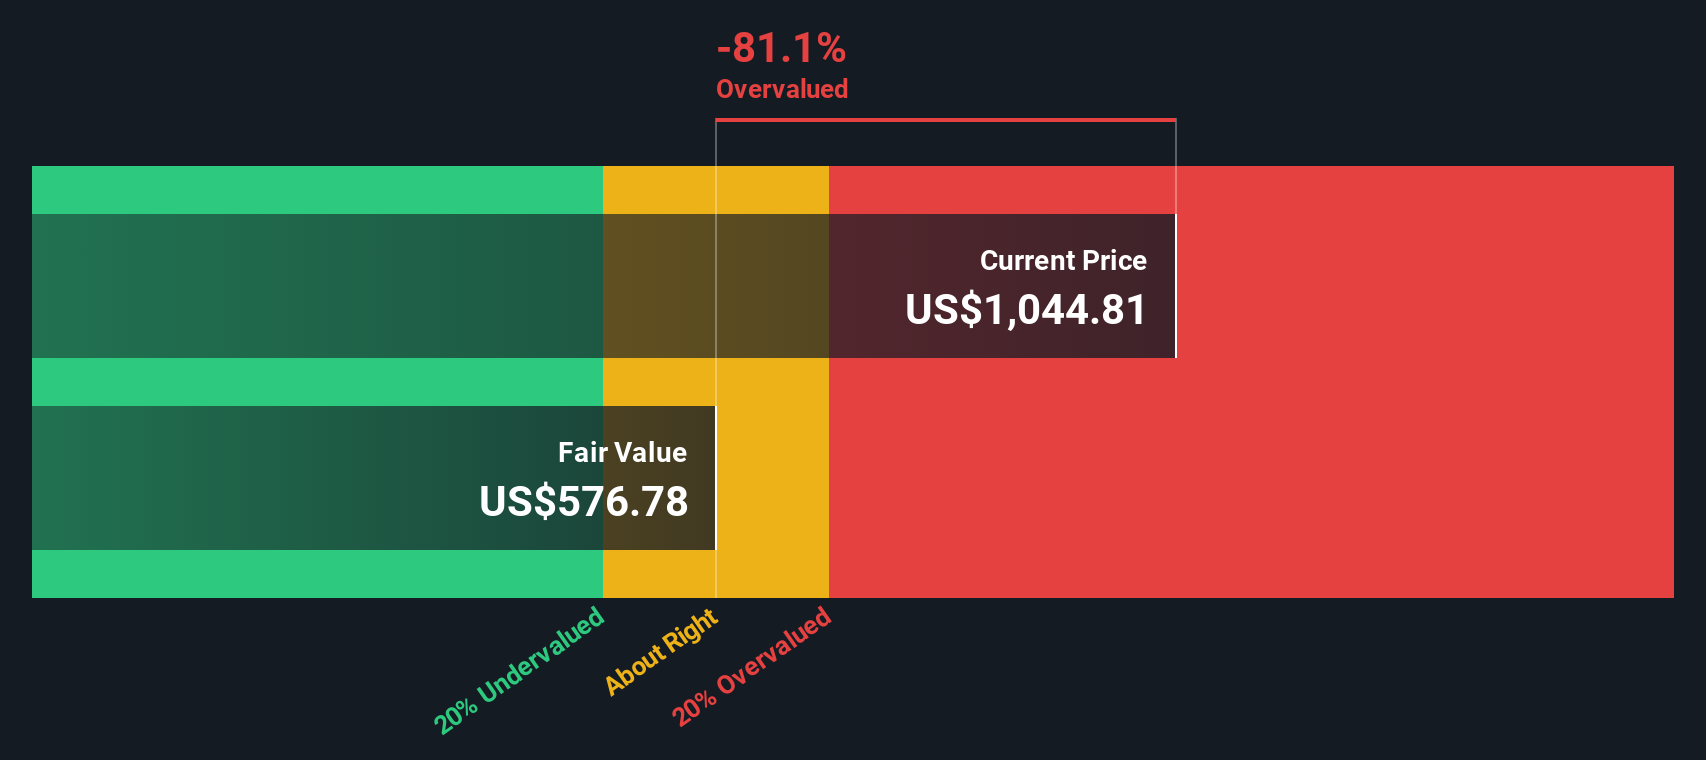
When all these future cash flows are discounted back, the DCF model arrives at an estimated intrinsic value of about $636.76 per share, in $. With the DCF implying that the stock is 92.5% overvalued relative to its current price, the model suggests that a lot of future optimism is already embedded in the share price.
Result: OVERVALUED
Our Discounted Cash Flow (DCF) analysis suggests KLA may be overvalued by 92.5%. Discover 895 undervalued stocks or create your own screener to find better value opportunities.
Approach 2: KLA Price vs Earnings
For established, profitable companies like KLA, the price to earnings, or PE, ratio is a practical way to judge valuation because it links what investors pay today to the profits the business is already generating. A higher PE can be justified when markets expect stronger, more reliable growth, while companies facing slower growth or higher risk typically deserve a lower, more conservative multiple.
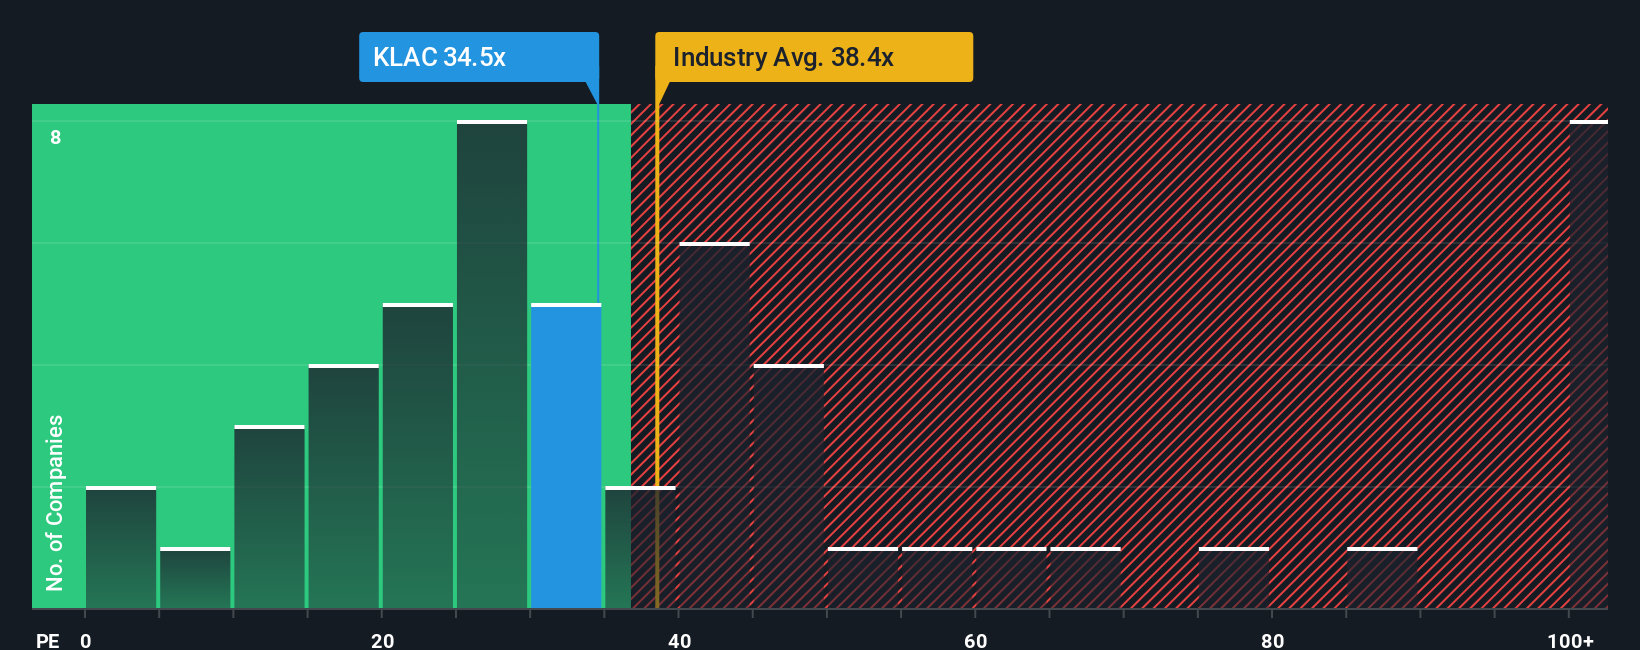
KLA currently trades on a PE of about 38.0x, which is roughly in line with the broader Semiconductor industry average of around 37.9x and slightly below its peer group at about 39.8x. On the surface, that suggests the stock is priced similarly to other quality chip equipment names, with no obvious premium or discount based purely on peer comparisons.
Simply Wall St’s Fair Ratio for KLA is 28.5x, a proprietary estimate of what the PE should be once factors like earnings growth, profitability, industry positioning, market cap and specific risks are taken into account. Because this measure is tailored to KLA’s own fundamentals rather than broad peer groups, it offers a more precise anchor for valuation. Comparing the current 38.0x PE to the 28.5x Fair Ratio points to KLA trading at a meaningful premium, indicating that the market may be overpaying for its strengths.
Result: OVERVALUED
PE ratios tell one story, but what if the real opportunity lies elsewhere? Discover 1450 companies where insiders are betting big on explosive growth.
Upgrade Your Decision Making: Choose your KLA Narrative
Earlier we mentioned that there is an even better way to understand valuation, so let us introduce you to Narratives, a simple framework that lets you attach a story, your view of KLA’s future revenue, earnings, margins and risks, to the numbers and turn that into a clear fair value estimate.
A Narrative links three things together in one place: the business story, a financial forecast and the resulting fair value. Instead of just accepting a PE or DCF output, you can see exactly which assumptions about AI demand, DRAM cycles, China exposure or margins are driving the valuation.
On Simply Wall St’s Community page, which is used by millions of investors, Narratives are easy to browse and create. They can help you assess potential opportunities by comparing each Narrative’s Fair Value to today’s Price and then updating those fair values dynamically as fresh news, earnings and analyst revisions come in.
For example, one KLA Narrative on the platform might assume a fair value of about $1,287 per share based on a particular view of AI-related demand, while a more cautious Narrative, focused on tariffs and China risk, might anchor closer to the lowest analyst target of $745. You can then decide which story, and valuation, makes more sense to you.
Do you think there's more to the story for KLA? Head over to our Community to see what others are saying!

This article by Simply Wall St is general in nature. We provide commentary based on historical data and analyst forecasts only using an unbiased methodology and our articles are not intended to be financial advice. It does not constitute a recommendation to buy or sell any stock, and does not take account of your objectives, or your financial situation. We aim to bring you long-term focused analysis driven by fundamental data. Note that our analysis may not factor in the latest price-sensitive company announcements or qualitative material. Simply Wall St has no position in any stocks mentioned.
Have feedback on this article? Concerned about the content? Get in touch with us directly. Alternatively, email editorial-team@simplywallst.com