
- PREMIUM
- LIVE QUOTES
- INSTITUTION
 Index Options
 State Street
 CME Group
 Nasdaq
 Cboe
Cboe TradingView
 Wall Street Journal
Ollie’s Bargain Outlet (OLLI) Q3: Same‑Store Sales Rebound Tests Premium Valuation Narrative
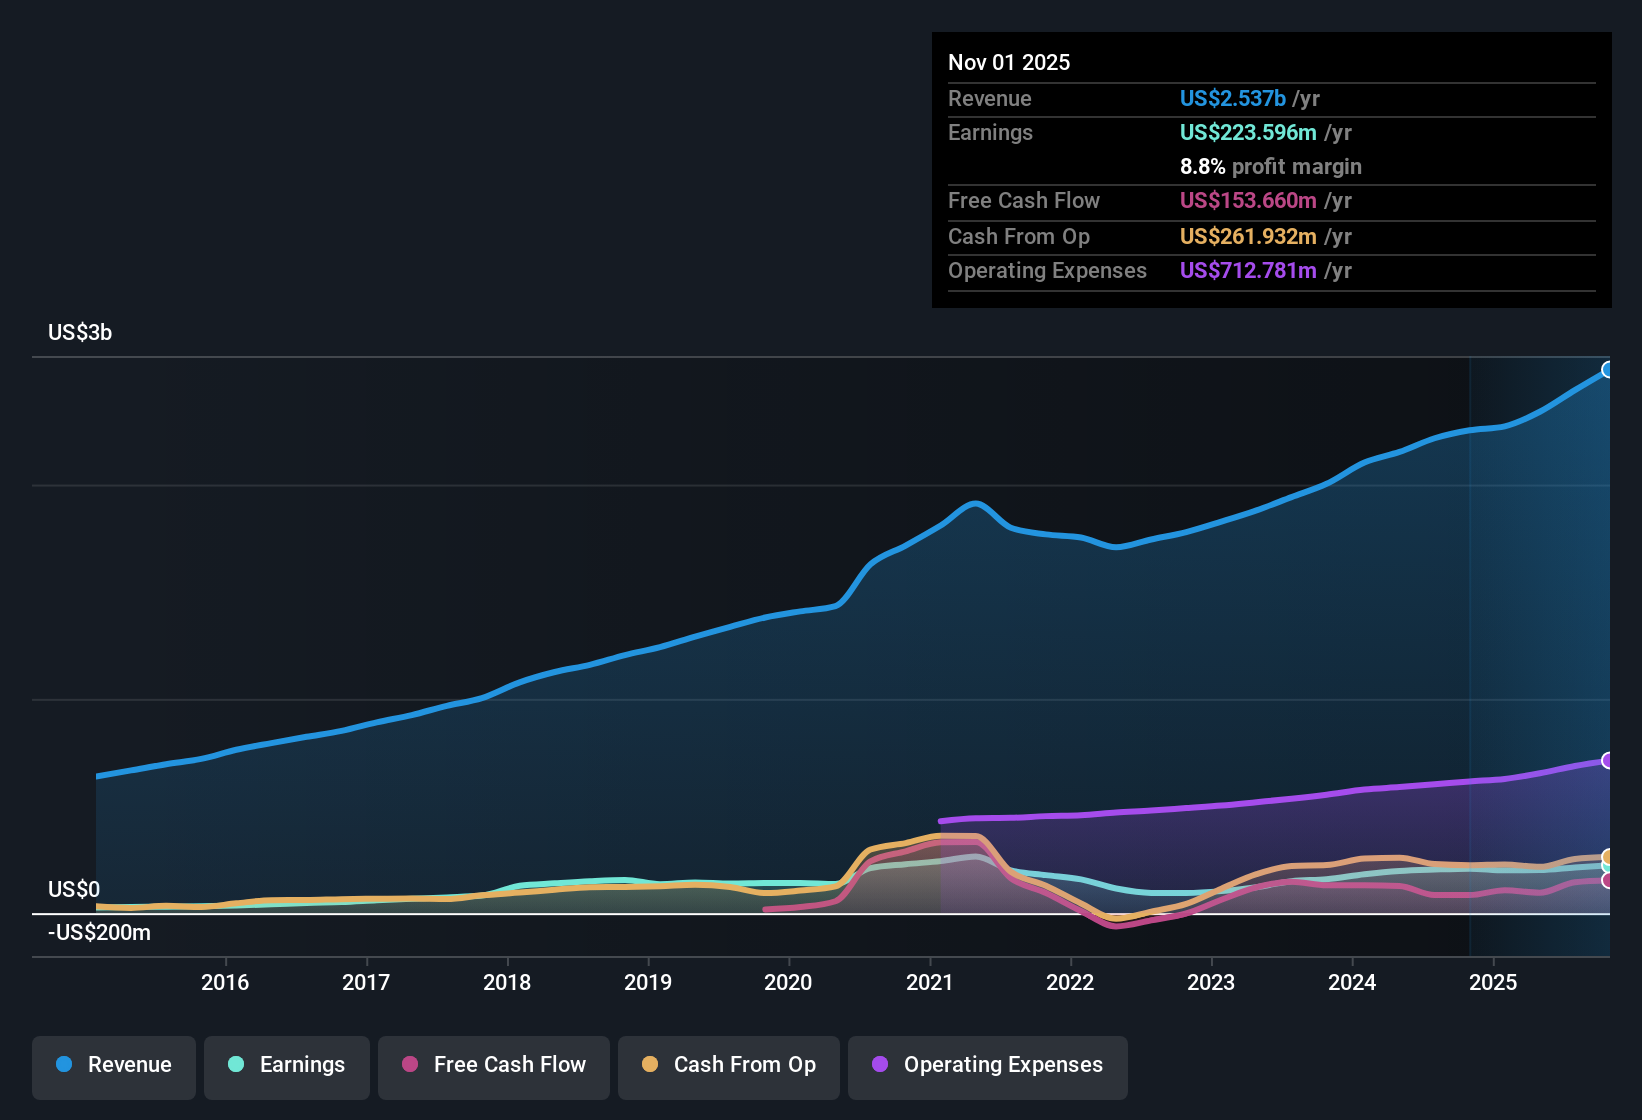
Ollie's Bargain Outlet Holdings (OLLI) has posted another solid update for Q3 2026, with revenue of about $613.6 million and EPS of $0.75, underpinned by trailing twelve month revenue of roughly $2.5 billion and EPS of $3.65 as the business keeps scaling its closeout retail model. The company has seen revenue move from $517.4 million in Q3 2025 to $613.6 million in Q3 2026, while EPS stepped up from $0.59 to $0.75 over the same period, giving investors a clearer picture of how the top line and per share profits are tracking together as margins ebb and flow.
See our full analysis for Ollie's Bargain Outlet Holdings.With the numbers on the table, the next step is to see how this latest print lines up with the dominant narratives around Ollie's, from growth durability to margin resilience, and where the data might prompt a reassessment.
See what the community is saying about Ollie's Bargain Outlet Holdings
Same Store Sales Swing Back Into Positive Territory
- After a 0.5% same store sales decline in Q3 2025, Ollie's posted positive same store growth of 2.6% in Q1 2026 and 5% in Q2 2026, showing a clear turnaround in store level performance over the last year.
- Analysts' consensus narrative links this improving in store trend to stronger customer engagement, noting that a growing value conscious consumer base and the Ollie's Army loyalty program are driving higher traffic and repeat visits, even as risks like rapid store expansion and limited e commerce could weigh on future comparable sales if new locations underperform or brick and mortar traffic slows.
- The shift from negative 0.5% same store sales in Q3 2025 to mid single digit growth in early 2026 aligns with the view that economic pressure is pushing more shoppers toward discount formats.
- At the same time, the narrative's warning about overextension feels relevant given that recent growth has come alongside double digit unit expansion, which could make sustaining these same store gains harder over time.
Margins Steady But Under Gentle Pressure
- On a trailing twelve month basis, net income is $223.6 million on $2.5 billion of revenue, implying an 8.8% net margin compared with 9.2% a year earlier, so profitability remains healthy but is slightly lower than last year.
- Consensus narrative emphasizes that better merchandise deals and supply chain efficiencies are supporting gross margins, yet the risk section points out that rising wages and sector wide cost pressures could squeeze net margins further, which fits with this modest move from 9.2% to 8.8%.
- The roughly $265.3 million increase in trailing revenue from $2.27 billion in Q4 2025 to $2.54 billion in Q3 2026 shows the business scaling, but net income has risen more slowly from $199.8 million to $223.6 million, reflecting that some of that growth is coming with thinner incremental margin.
- This gap between solid top line momentum and slightly softer margin directly speaks to the bearish concern that persistent inflation, wage growth, and competition among discounters could make it harder for Ollie's to fully translate higher sales into profits over time.
Even with this mild margin drift, many investors are watching how management balances discount driven traffic with cost discipline as the model scales.
🐻 Ollie's Bargain Outlet Holdings Bear CasePremium Valuation Versus Growth Outlook
- At a share price of $114.07 and trailing EPS of $3.65, Ollie's trades on a P E of 31.3 times, above its 12.1% forecast annual revenue growth and 14.6% forecast annual earnings growth, and well above its DCF fair value of about $75.01.
- Consensus narrative argues that ongoing double digit revenue growth, projected EPS of $5.52 by around 2028, and expanding margins can justify paying up, but the valuation data highlights tension here, because the current multiple is higher than both the 19.9 times industry average and the 18 times peer average, even though earnings growth is actually forecast to be slightly slower than the broader US market at 16.2% per year.
- Forecast earnings growth of 14.6% and recent 7.7% year over year EPS growth support a bullish case for continued profit expansion, yet the stock already commands a premium P E versus the sector, meaning a lot of that optimism is priced in.
- Analyst targets of $143.80 suggest upside from $114.07, but the gap versus DCF fair value at $75.01 gives bears a concrete data point to argue that the shares could be expensive if growth or margins fall short of expectations.
Next Steps
To see how these results tie into long-term growth, risks, and valuation, check out the full range of community narratives for Ollie's Bargain Outlet Holdings on Simply Wall St. Add the company to your watchlist or portfolio so you'll be alerted when the story evolves.
See the numbers differently? Turn that perspective into a focused story of your own in just a few minutes with Do it your way.
A good starting point is our analysis highlighting 3 key rewards investors are optimistic about regarding Ollie's Bargain Outlet Holdings.
Explore Alternatives
Ollie's combines solid growth with softening margins and a stretched valuation, leaving little room for error if earnings or sentiment slip.
If paying a premium here feels risky, use our these 895 undervalued stocks based on cash flows to quickly shift your focus toward companies where cash flow driven valuations still leave meaningful upside on the table.
This article by Simply Wall St is general in nature. We provide commentary based on historical data and analyst forecasts only using an unbiased methodology and our articles are not intended to be financial advice. It does not constitute a recommendation to buy or sell any stock, and does not take account of your objectives, or your financial situation. We aim to bring you long-term focused analysis driven by fundamental data. Note that our analysis may not factor in the latest price-sensitive company announcements or qualitative material. Simply Wall St has no position in any stocks mentioned.
Have feedback on this article? Concerned about the content? Get in touch with us directly. Alternatively, email editorial-team@simplywallst.com