
- PREMIUM
- LIVE QUOTES
- INSTITUTION
 Index Options
 State Street
 CME Group
 Nasdaq
 Cboe
Cboe TradingView
 Wall Street Journal
Is Baker Hughes Still Attractively Priced After Its Strong Multi Year Run in 2025?
- Wondering if Baker Hughes is still a smart buy after its big multi year run, or if you would be overpaying at today’s price? You are not alone, and that is exactly what we will unpack here.
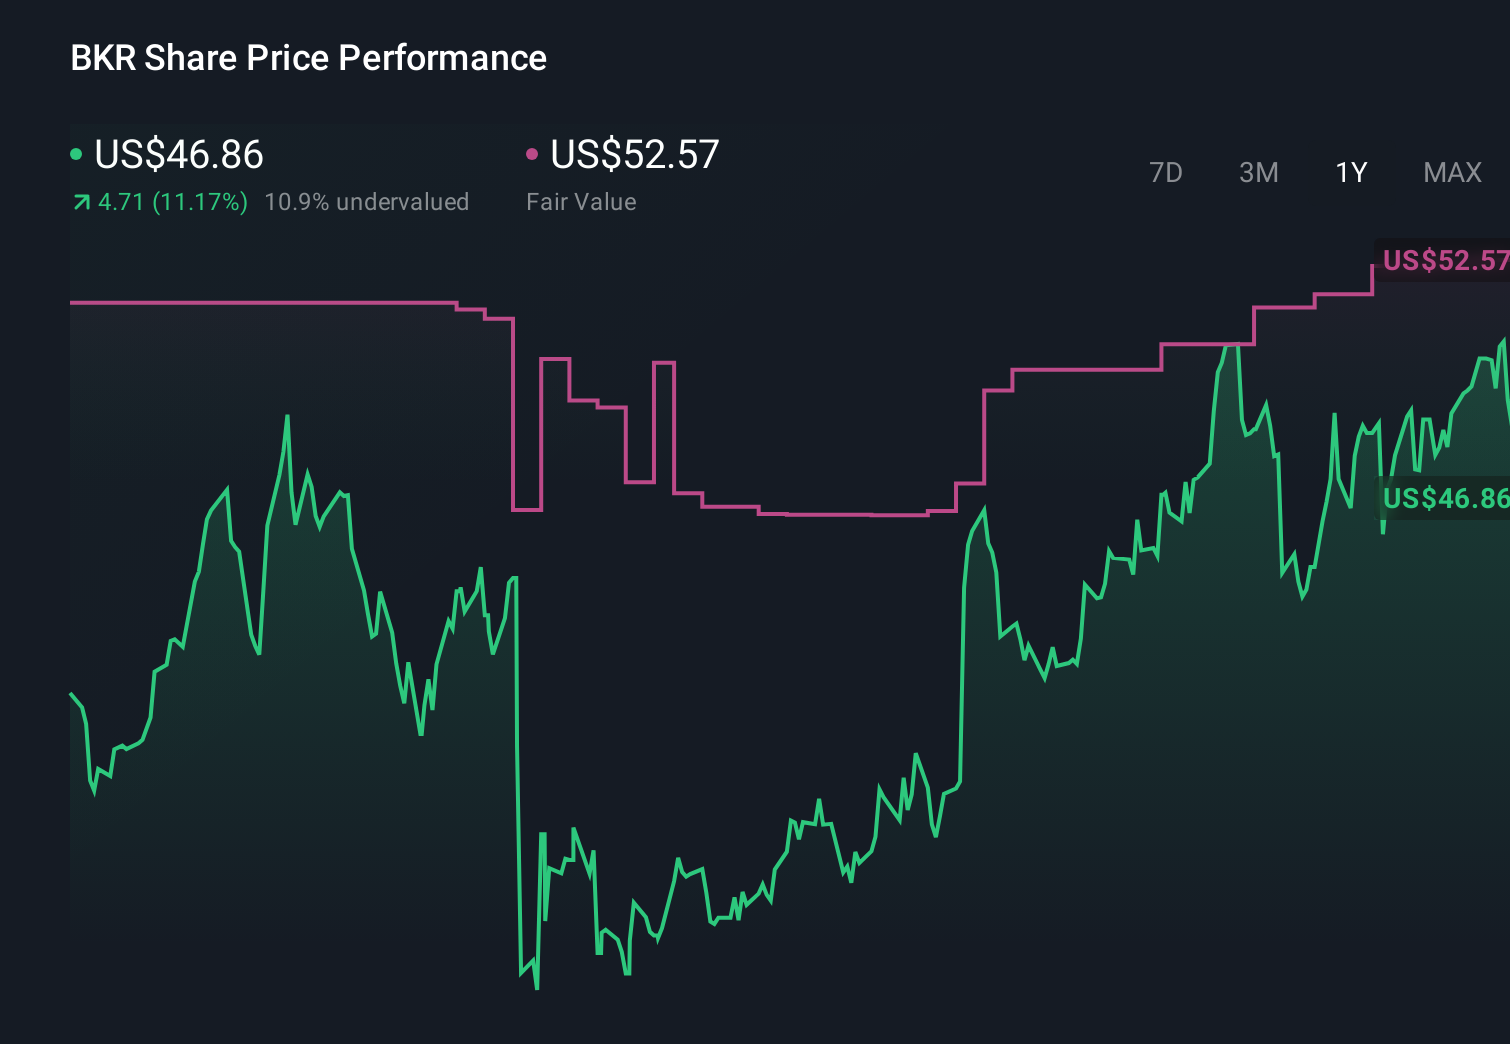
- Even after a recent pullback of 5.5% over the last week and 2.3% over the past month, the stock is still up 14.7% year to date and has delivered a 152.1% gain over five years. This naturally raises the question of whether the current price already bakes in the upside.
- Recent headlines have focused on Baker Hughes’ growing role in energy transition technologies alongside its traditional oilfield services, with investors paying close attention to large contract wins and strategic partnerships in areas like LNG and carbon capture. At the same time, the broader energy sector has been volatile as markets continually re price geopolitical risk and long term demand for fossil fuels, adding more noise around where Baker Hughes should trade.
- Right now, Baker Hughes scores a 5/6 valuation check, suggesting it screens as undervalued on most of the metrics tracked. However, that headline number only tells part of the story. Next, the different valuation approaches behind that score will be broken down, followed by an intuitive way to think about what Baker Hughes might really be worth.
Approach 1: Baker Hughes Discounted Cash Flow (DCF) Analysis
A Discounted Cash Flow model estimates what a business is worth by projecting future cash flows and then discounting them back to today, to reflect the time value of money and risk.
For Baker Hughes, the model uses a 2 Stage Free Cash Flow to Equity approach. The company generated roughly $2.1 billion in free cash flow over the last twelve months, and analysts expect this to grow steadily, reaching about $2.8 billion by 2028. Beyond the explicit analyst window, Simply Wall St extrapolates cash flows out to 2035, with projected free cash flow rising to around $3.9 billion, but at a slowing growth rate over time.
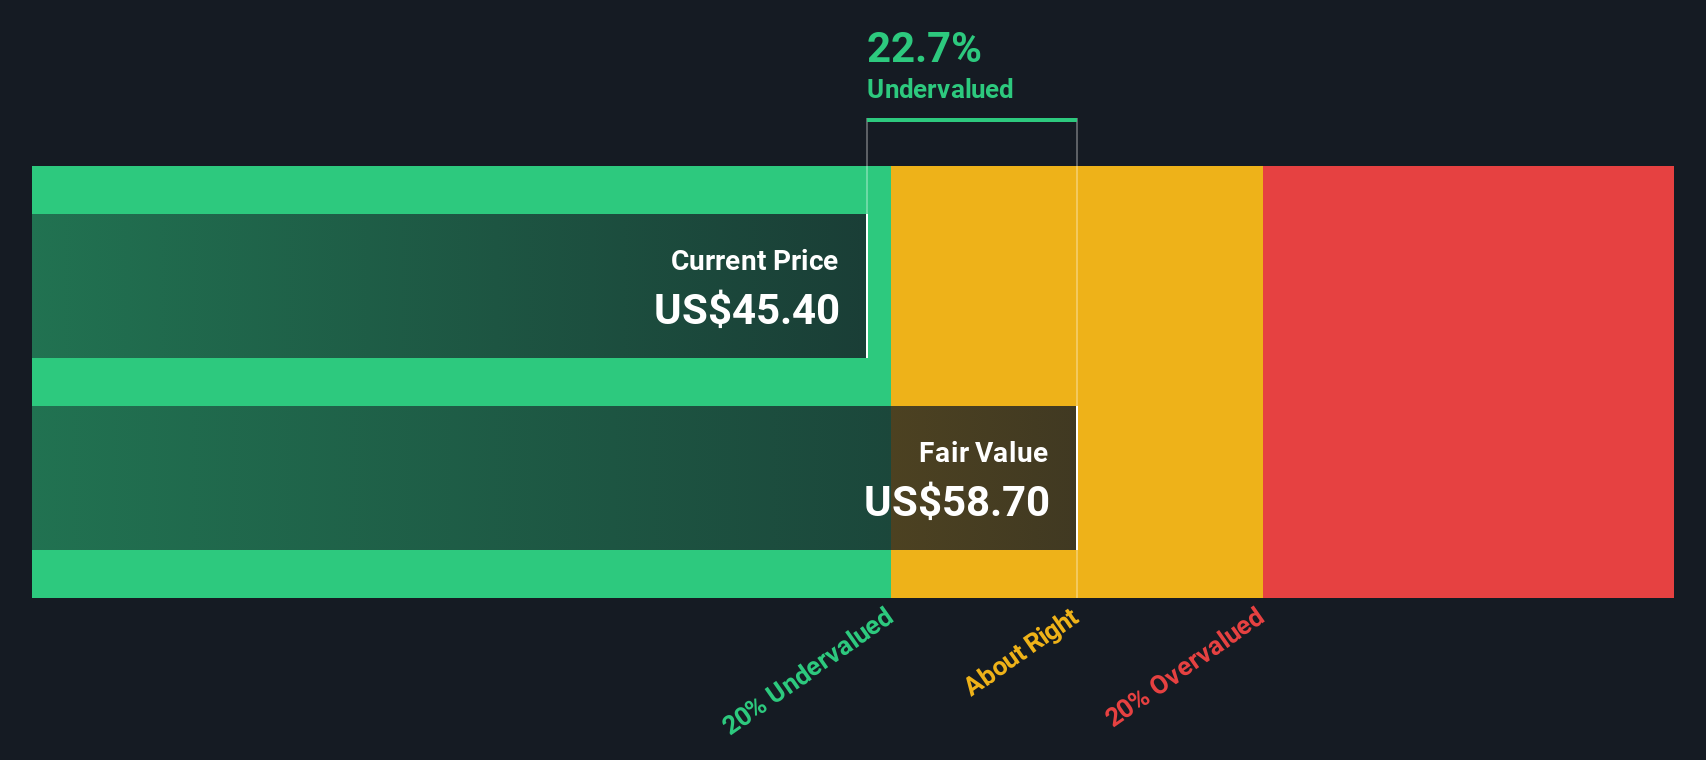
When all those future cash flows are discounted back and summed, the model produces an estimated intrinsic value of about $72.55 per share. Compared with the current market price, this implies Baker Hughes is trading at roughly a 34.3% discount, suggesting the market is not fully pricing in its future cash generation.
Result: UNDERVALUED
Our Discounted Cash Flow (DCF) analysis suggests Baker Hughes is undervalued by 34.3%. Track this in your watchlist or portfolio, or discover 899 more undervalued stocks based on cash flows.
Approach 2: Baker Hughes Price vs Earnings
For a profitable business like Baker Hughes, the price to earnings ratio is a practical way to gauge how much investors are willing to pay for each dollar of current earnings. In general, companies with stronger growth prospects and lower perceived risk justify higher PE ratios, while slower growing or riskier names tend to trade on lower multiples.
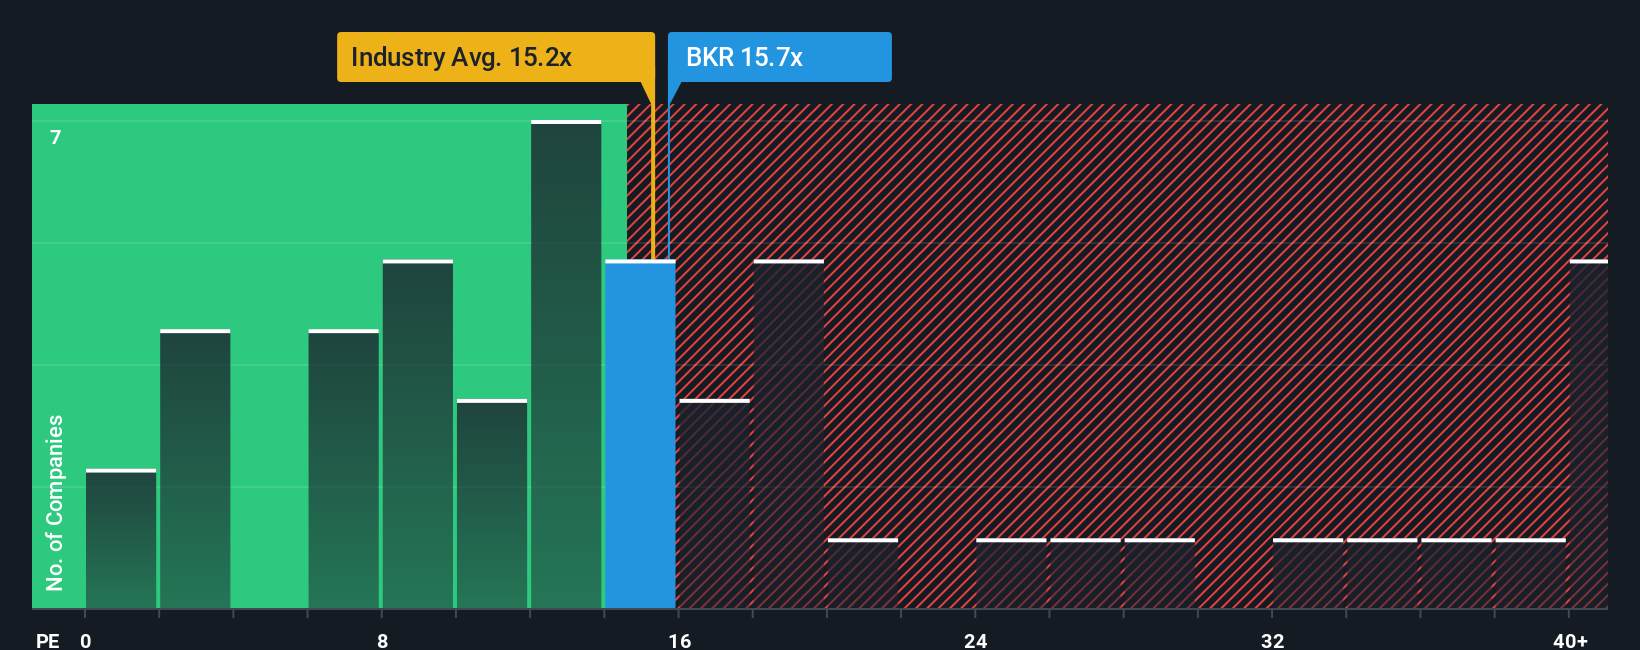
Baker Hughes currently trades on a PE of about 16.3x. That sits slightly below both the Energy Services industry average of around 18.2x and the peer group average of roughly 17.1x, which points to a modest valuation discount relative to similar companies. Simply Wall St also estimates a proprietary Fair Ratio for Baker Hughes of about 18.9x, which reflects what the PE should be given its earnings growth outlook, margins, industry positioning, market cap and risk profile.
This Fair Ratio is more informative than a simple peer or industry comparison, because it adjusts for Baker Hughes specific fundamentals rather than assuming all companies deserve the same multiple. With the Fair Ratio of 18.9x sitting meaningfully above the current 16.3x, the preferred multiple view suggests the stock is still trading at an attractive discount.
Result: UNDERVALUED
PE ratios tell one story, but what if the real opportunity lies elsewhere? Discover 1450 companies where insiders are betting big on explosive growth.
Upgrade Your Decision Making: Choose your Baker Hughes Narrative
Earlier we mentioned that there is an even better way to understand valuation, so let us introduce you to Narratives, a simple way to connect your view of Baker Hughes with the numbers that sit behind it. A Narrative is your story about the company, expressed through assumptions about its future revenue, earnings and margins, which then roll into a financial forecast and a fair value estimate you can compare directly to today’s share price. On Simply Wall St’s Community page, used by millions of investors, Narratives make this process accessible, helping you decide whether Baker Hughes is a buy, hold or sell by showing whether your Fair Value sits above or below the current Price, and then updating dynamically as fresh news, earnings and analyst revisions arrive. For example, one Baker Hughes Narrative on the platform might see fair value near the bullish 60 dollar target, assuming strong execution in energy transition and digital infrastructure. Another more cautious Narrative could anchor closer to the bearish 37 dollar view, focusing on oil and gas cyclicality and policy risk.
Do you think there's more to the story for Baker Hughes? Head over to our Community to see what others are saying!
This article by Simply Wall St is general in nature. We provide commentary based on historical data and analyst forecasts only using an unbiased methodology and our articles are not intended to be financial advice. It does not constitute a recommendation to buy or sell any stock, and does not take account of your objectives, or your financial situation. We aim to bring you long-term focused analysis driven by fundamental data. Note that our analysis may not factor in the latest price-sensitive company announcements or qualitative material. Simply Wall St has no position in any stocks mentioned.
Have feedback on this article? Concerned about the content? Get in touch with us directly. Alternatively, email editorial-team@simplywallst.com