
- PREMIUM
- LIVE QUOTES
- INSTITUTION
 Index Options
 State Street
 CME Group
 Nasdaq
 Cboe
Cboe TradingView
 Wall Street Journal
Does Kite Realty Group Trust’s Choppy 2025 Performance Signal a Mispriced Opportunity?
- If you are wondering whether Kite Realty Group Trust is quietly trading at a discount, or if the market has it about right, you are not alone in trying to figure out whether now is a smart entry point.
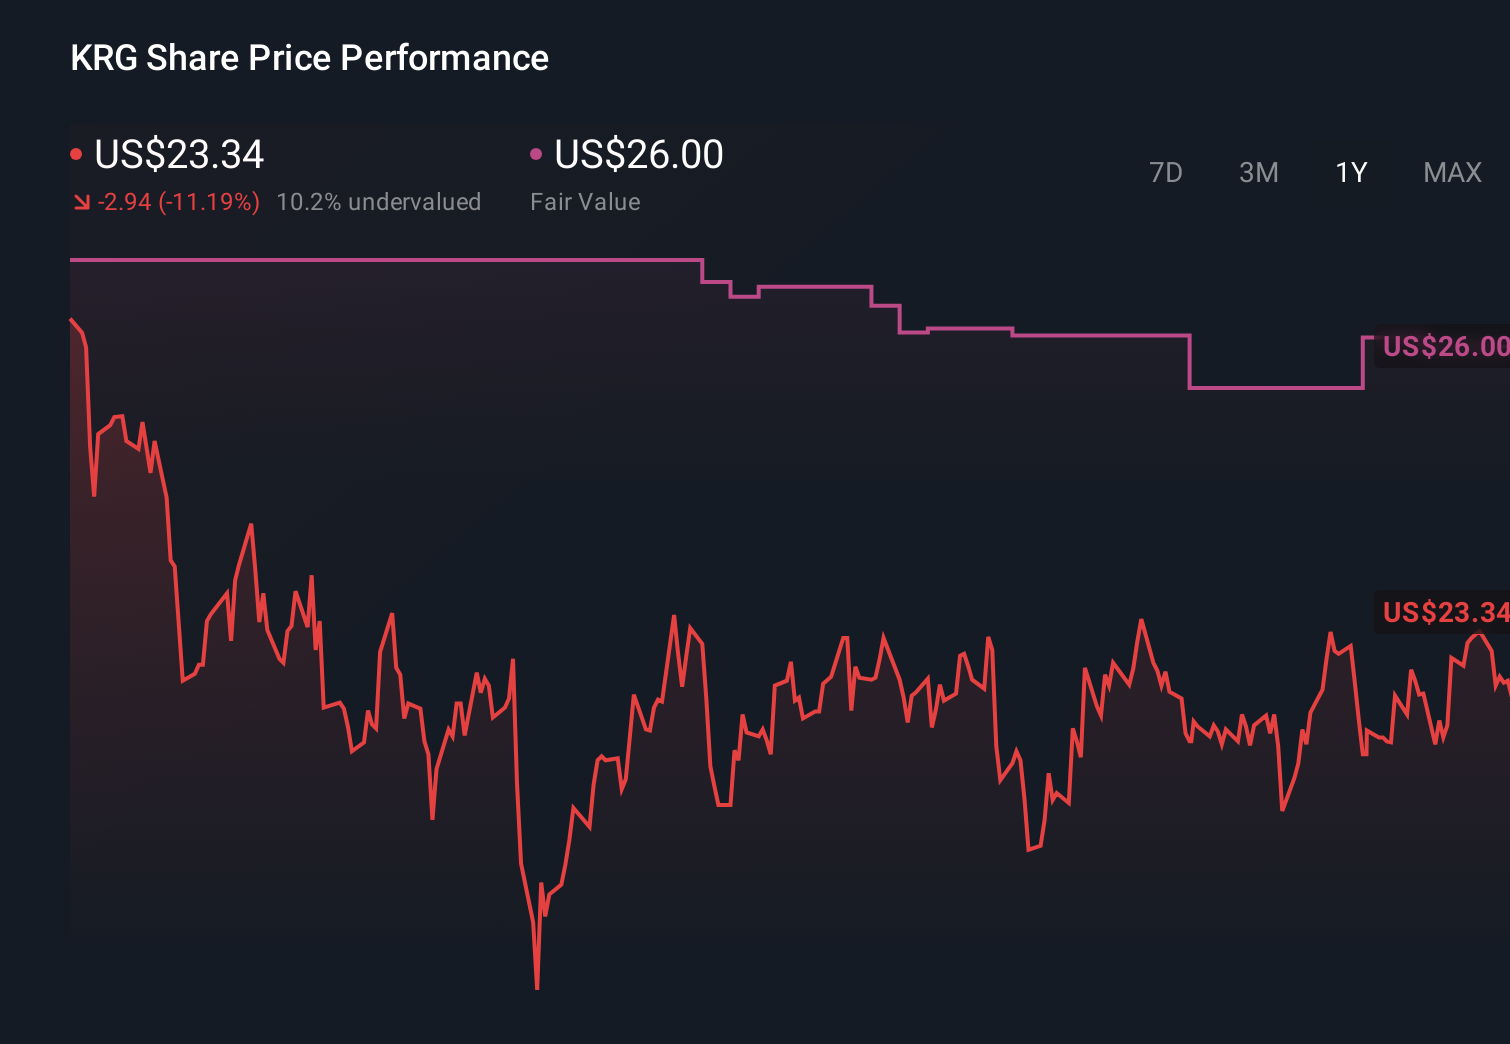
- The stock has been choppy recently, slipping about 0.2% over the last week but edging up 1.5% over the past month, while still sitting on a -8.5% year-to-date return and -9.4% 1-year return after a strong 17.5% 3-year and 83.4% 5-year run.
- Recent headlines have focused on shifting expectations around retail real estate demand and the resilience of open-air shopping centers, putting a spotlight on REITs like Kite. At the same time, broader interest rate moves and changing views on commercial property risk are helping explain why the share price has not fully kept pace with its longer-term performance.
- On our valuation framework, Kite Realty Group Trust scores a 2/6 for being undervalued, which suggests some metrics hint at value while others flash caution. Next we will break down those different valuation approaches before exploring an even more insightful way to think about what the stock is really worth.
Kite Realty Group Trust scores just 2/6 on our valuation checks. See what other red flags we found in the full valuation breakdown.
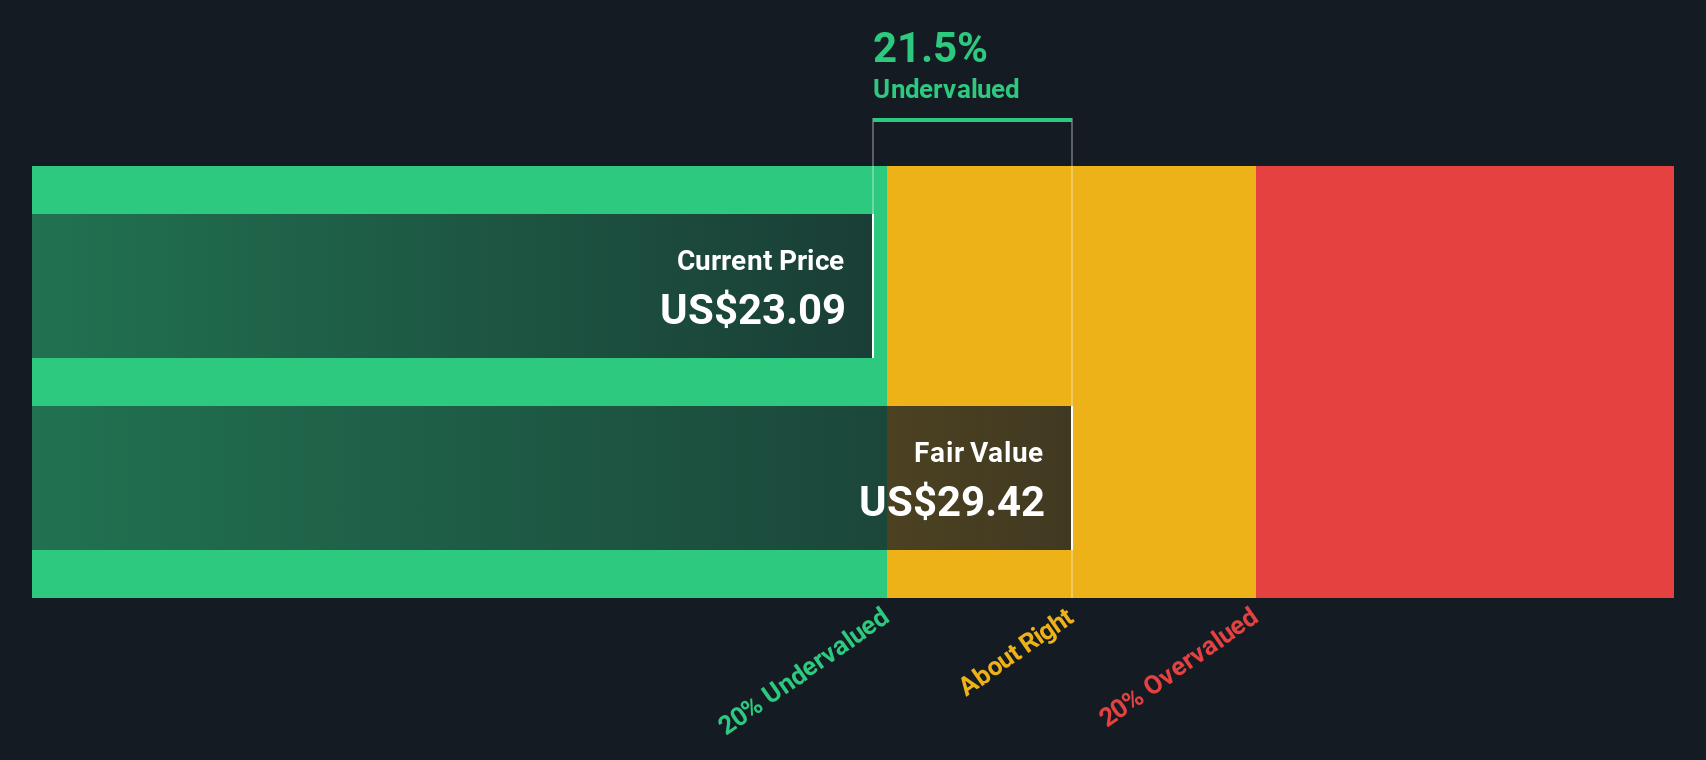
Approach 1: Kite Realty Group Trust Discounted Cash Flow (DCF) Analysis
A Discounted Cash Flow model estimates what Kite Realty Group Trust is worth by projecting its adjusted funds from operations into the future and then discounting those cash flows back to today's dollars.
For Kite, the model starts with last twelve months free cash flow of about $507.5 Million and uses analyst expectations for the next few years. It then extends those trends further out, with Simply Wall St extrapolating where analyst coverage stops. By 2028, free cash flow is projected at roughly $344.4 Million, with additional gradual growth implied out to 2035 as cash flows continue to rise at low single digit rates.
Bringing all those future cash flows back to today using an appropriate discount rate yields an estimated intrinsic value of about $29.41 per share. Compared with the current share price, this implies the stock is trading at a 23.1% discount. This suggests the market is pricing in more risk or weaker growth than the DCF assumes.
Result: UNDERVALUED
Our Discounted Cash Flow (DCF) analysis suggests Kite Realty Group Trust is undervalued by 23.1%. Track this in your watchlist or portfolio, or discover 899 more undervalued stocks based on cash flows.
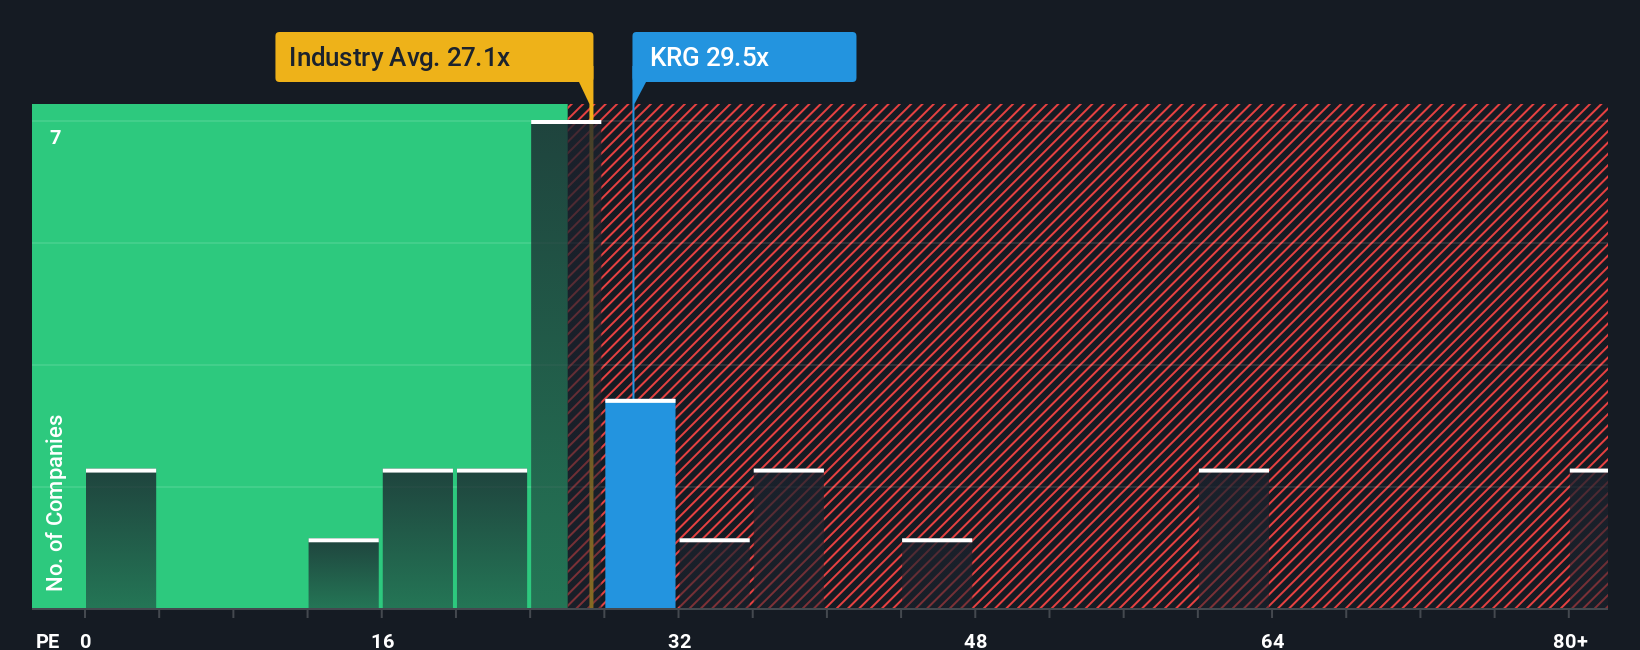
Approach 2: Kite Realty Group Trust Price vs Earnings
For profitable companies like Kite Realty Group Trust, the Price to Earnings (PE) ratio is a practical way to gauge how much investors are willing to pay for each dollar of current earnings. A higher PE can be justified when the market expects stronger growth or sees the business as relatively low risk. Slower growth or higher uncertainty typically calls for a lower, more conservative PE.
Kite currently trades on a PE of about 35.1x, which sits above both the Retail REITs industry average of roughly 26.6x and the peer group average of around 32.7x. On the surface, that suggests the stock is priced at a premium to its sector. However, Simply Wall St’s Fair Ratio framework estimates a fair PE for Kite at about 25.8x, based on its specific mix of earnings growth, margins, size, industry positioning, and risk profile.
Because the Fair Ratio is tailored to Kite’s fundamentals rather than broad benchmarks, it is a more precise yardstick than simple peer or industry comparisons. With the actual PE of 35.1x sitting notably above the 25.8x Fair Ratio, the shares look somewhat expensive on this measure.
Result: OVERVALUED
PE ratios tell one story, but what if the real opportunity lies elsewhere? Discover 1450 companies where insiders are betting big on explosive growth.
Upgrade Your Decision Making: Choose your Kite Realty Group Trust Narrative
Earlier we mentioned that there is an even better way to understand valuation, so let us introduce you to Narratives, which are simply your story about a company translated into numbers like future revenue, earnings, margins, and a fair value estimate that you can easily build and track on Simply Wall St’s Community page used by millions of investors. A Narrative connects three things: what you believe about Kite Realty Group Trust’s business, how that belief flows into a financial forecast, and the fair value that results from those assumptions, so you can clearly see whether the current price looks attractive or stretched. Narratives are dynamic, updating automatically when fresh news or earnings are released, so your fair value view stays aligned with the latest information rather than becoming stale. For example, one investor might build a bullish Kite narrative with strong Sunbelt leasing, improving margins and a fair value near the high analyst target of about $32, while another may focus on tenant bankruptcies, execution risks and slower growth, leading them to a fair value closer to the low target of roughly $22, and each can then compare their fair value to today’s price to decide whether to buy, hold, or sell.
Do you think there's more to the story for Kite Realty Group Trust? Head over to our Community to see what others are saying!
This article by Simply Wall St is general in nature. We provide commentary based on historical data and analyst forecasts only using an unbiased methodology and our articles are not intended to be financial advice. It does not constitute a recommendation to buy or sell any stock, and does not take account of your objectives, or your financial situation. We aim to bring you long-term focused analysis driven by fundamental data. Note that our analysis may not factor in the latest price-sensitive company announcements or qualitative material. Simply Wall St has no position in any stocks mentioned.
Have feedback on this article? Concerned about the content? Get in touch with us directly. Alternatively, email editorial-team@simplywallst.com