
- PREMIUM
- LIVE QUOTES
- INSTITUTIONS
 Index Options
 State Street
 CME Group
 Nasdaq
 Cboe
Cboe TradingView
 Wall Street Journal
Has Medtronic’s Recent 24% Rally Left Enough Upside After Robotics and Diabetes Push?
- If you are wondering whether Medtronic remains a solid value play after its recent run, or if the easy money has already been made, you are in the right place.
- Despite a soft patch over the last week, with the share price down around 2.3%, the stock is still up roughly 7.5% over the past month and about 24% both year to date and over the last year. That performance has investors rethinking its upside and risk profile.
- Recent headlines have focused on Medtronic doubling down on high growth areas such as robotics-assisted surgery and diabetes technology, along with regulatory approvals that strengthen its position in cardiac and neuro devices. At the same time, portfolio moves and ongoing innovation have reinforced the market view that this is a steadier blue chip name in a healthcare space that is not short on competition or disruption.
- Even with that backdrop, Medtronic only scores a 4/6 on our valuation checks. This suggests the market may be underpricing some parts of the story while fairly valuing others. We will walk through the traditional valuation approaches next, before finishing with a more complete way to think about what the stock is really worth.
Approach 1: Medtronic Discounted Cash Flow (DCF) Analysis
A Discounted Cash Flow model estimates what a company is worth today by projecting the cash it can generate in the future and then discounting those cash flows back to a present value.
For Medtronic, the latest twelve month Free Cash Flow is about $5.3 billion. Analysts expect this to rise steadily, with Simply Wall St using a two stage Free Cash Flow to Equity model that blends analyst forecasts for the next few years with more conservative extrapolations after that. Under this framework, projected Free Cash Flow reaches roughly $10.2 billion by 2035, reflecting mid single digit annual growth from the current base.
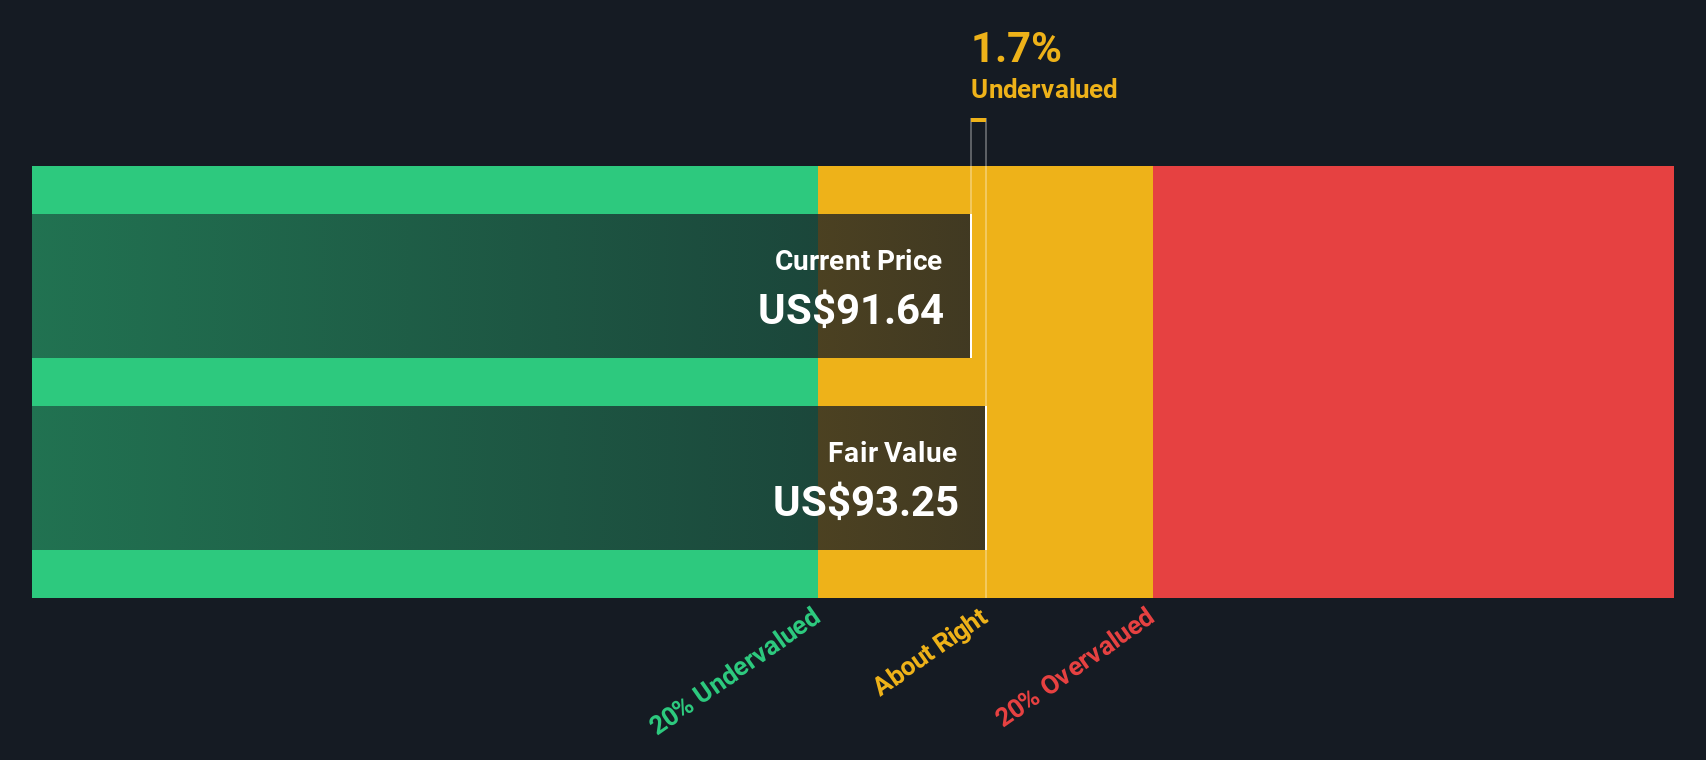
When all these future cash flows are discounted back, the intrinsic value comes out at around $104.17 per share. Compared to the current share price, this implies the stock is about 4.4% undervalued, which is a modest margin of safety rather than a deep bargain.
Result: ABOUT RIGHT
Medtronic is fairly valued according to our Discounted Cash Flow (DCF), but this can change at a moment's notice. Track the value in your watchlist or portfolio and be alerted on when to act.
Approach 2: Medtronic Price vs Earnings
For a mature, profitable business like Medtronic, the Price to Earnings (PE) ratio is a useful way to gauge value because it directly compares what investors pay today with the company’s current earnings power. In general, faster expected growth and lower risk justify a higher PE, while slower growth and higher risk usually mean a lower “normal” or “fair” multiple.
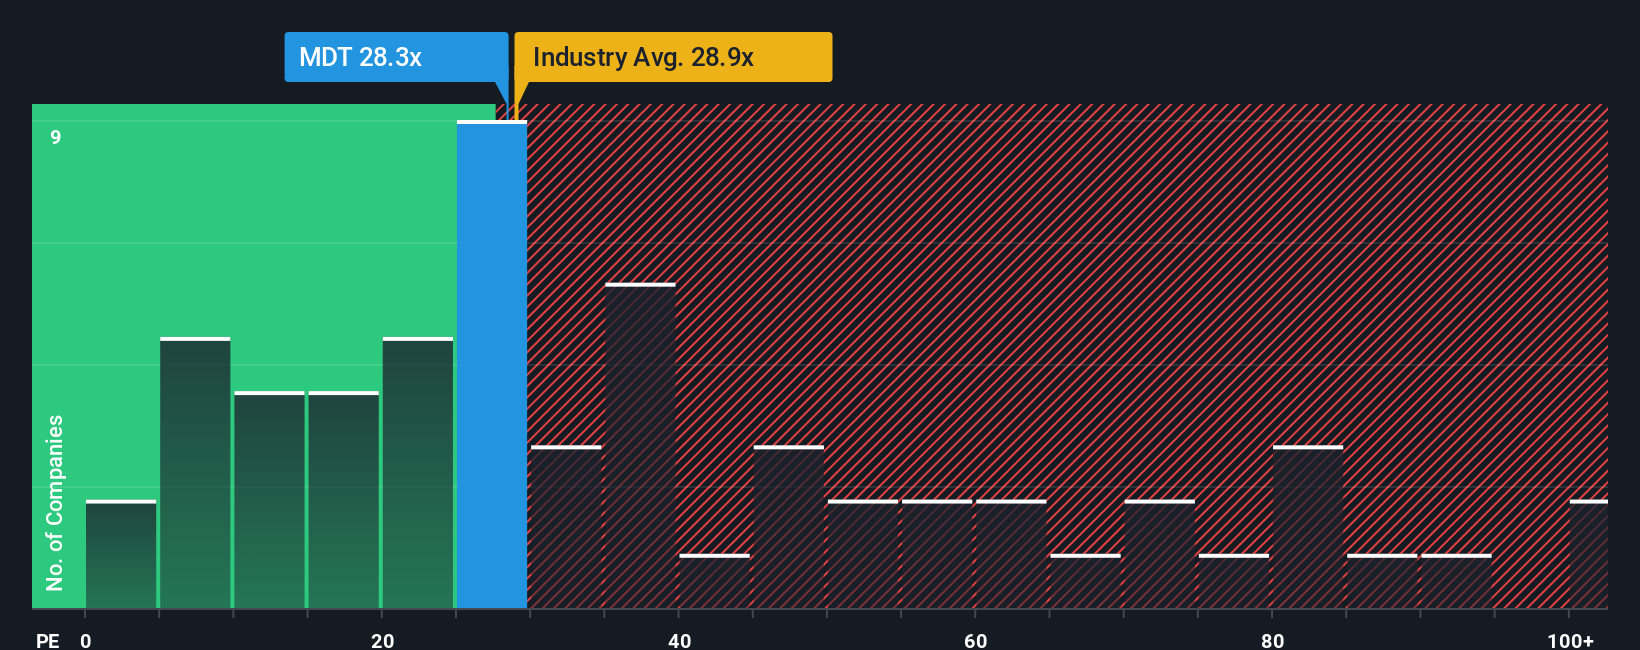
Medtronic currently trades on about 26.8x earnings, which is below both the broader Medical Equipment industry average of roughly 29.5x and the peer group average of around 45.4x. Simply Wall St’s proprietary “Fair Ratio” for Medtronic comes in at 32.0x. This is the PE level the model suggests is appropriate given its earnings growth outlook, industry positioning, profit margins, market cap and specific risk profile.
This Fair Ratio is more informative than a simple comparison to peers or the sector because it adjusts for Medtronic’s own fundamentals rather than assuming all companies deserve the same multiple. With the stock trading at 26.8x versus a fair 32.0x, Medtronic screens as modestly undervalued on an earnings multiple basis.
Result: UNDERVALUED
PE ratios tell one story, but what if the real opportunity lies elsewhere? Discover 1450 companies where insiders are betting big on explosive growth.
Upgrade Your Decision Making: Choose your Medtronic Narrative
Earlier we mentioned that there is an even better way to understand valuation, so let us introduce you to Narratives, which are simply your story about a company, connected to your own view of its fair value and the numbers you think it can deliver in the future.
Instead of stopping at a PE or DCF output, a Narrative on Simply Wall St links three things together in a single, easy framework: the business story you believe, the revenue, earnings and margin path that story implies, and the fair value that naturally falls out of those assumptions.
These Narratives live in the Community page on Simply Wall St, where millions of investors can quickly set or adjust their assumptions, compare the resulting Fair Value with the current share price, and see whether their story suggests buy, hold or sell today.
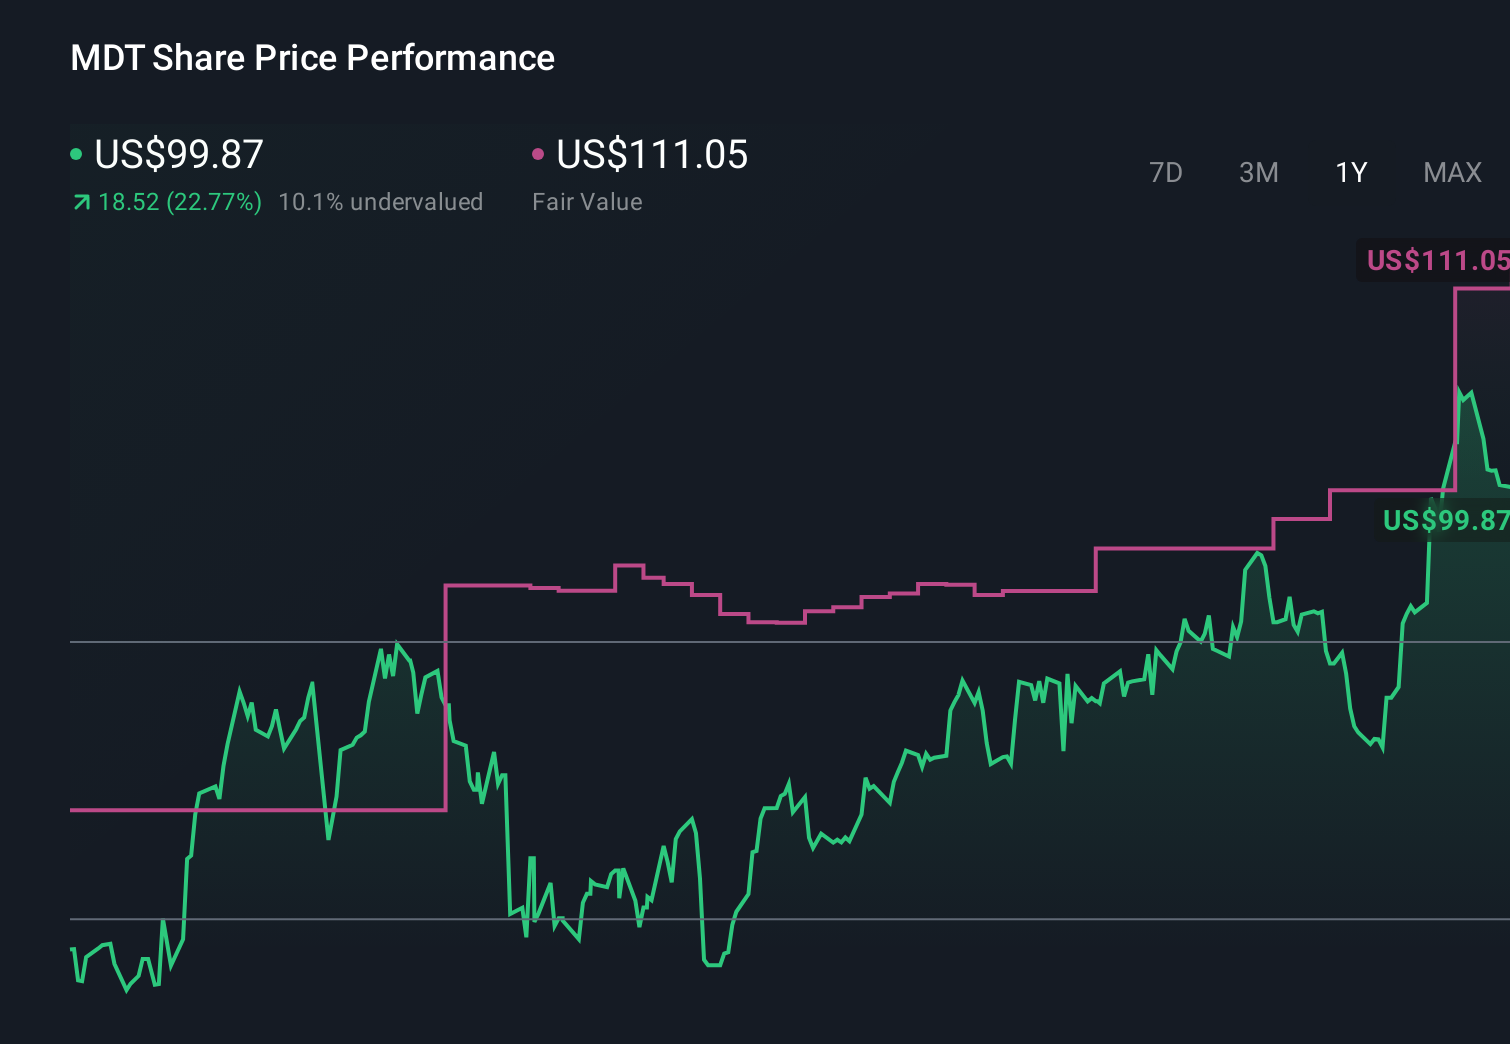
Because Narratives are updated as new information flows in, such as fresh earnings, product approvals or news, your Medtronic view can evolve automatically. One investor might run a more cautious Narrative that lands near $95 per share, while another, more optimistic on robotics and diabetes execution, might justify something closer to $111, all using the same simple tool.
For Medtronic however we'll make it really easy for you with previews of two leading Medtronic Narratives:
Fair value: $111.05 per share
Implied upside vs last close: 10.3% undervalued
Expected revenue growth: 5.79%
- Builds on strong cardiovascular and broader device momentum, leveraging digital health, robotics and AI enabled platforms to drive steady top line growth and market share gains.
- Assumes operational restructuring, a Diabetes separation and efficiency programs will gently lift margins and support mid single digit revenue growth with improving earnings power.
- Sees the current price as leaving room for upside if Medtronic executes on its innovation pipeline and emerging market expansion while managing execution and spin off risks.
Fair value: $95.00 per share
Implied downside vs last close: 4.9% overvalued
Expected revenue growth: 5.15%
- Recognises Medtronic’s diversified portfolio, global reach and innovation in robotics and diabetes but argues much of this strength is already reflected in the share price.
- Highlights ongoing challenges in the Diabetes segment, intense competition in key categories and regulatory or recall risks that could constrain margins and growth.
- Views valuation as full given execution risks around new technologies, macro and supply chain headwinds and the possibility that hardware focused strategies face disruption from faster moving, software led competitors.
Do you think there's more to the story for Medtronic? Head over to our Community to see what others are saying!
This article by Simply Wall St is general in nature. We provide commentary based on historical data and analyst forecasts only using an unbiased methodology and our articles are not intended to be financial advice. It does not constitute a recommendation to buy or sell any stock, and does not take account of your objectives, or your financial situation. We aim to bring you long-term focused analysis driven by fundamental data. Note that our analysis may not factor in the latest price-sensitive company announcements or qualitative material. Simply Wall St has no position in any stocks mentioned.
Have feedback on this article? Concerned about the content? Get in touch with us directly. Alternatively, email editorial-team@simplywallst.com