
- PREMIUM
- LIVE QUOTES
- INSTITUTION
 Index Options
 State Street
 CME Group
 Nasdaq
 Cboe
Cboe TradingView
 Wall Street Journal
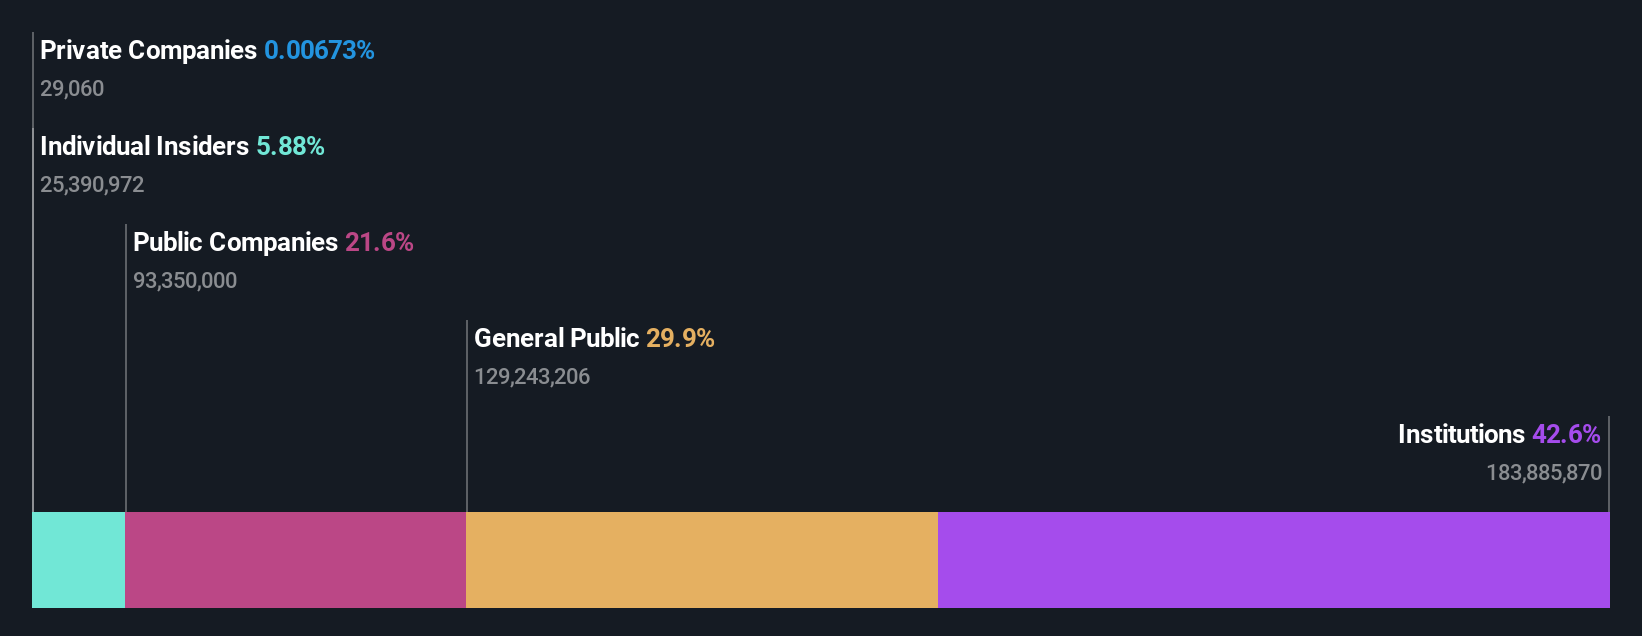
AB Industrivärden (publ) (STO:INDU A) is largely controlled by institutional shareholders who own 43% of the company
Key Insights
- Significantly high institutional ownership implies AB Industrivärden's stock price is sensitive to their trading actions
- 52% of the business is held by the top 8 shareholders
- Ownership research, combined with past performance data can help provide a good understanding of opportunities in a stock
To get a sense of who is truly in control of AB Industrivärden (publ) (STO:INDU A), it is important to understand the ownership structure of the business. The group holding the most number of shares in the company, around 43% to be precise, is institutions. That is, the group stands to benefit the most if the stock rises (or lose the most if there is a downturn).
Because institutional owners have a huge pool of resources and liquidity, their investing decisions tend to carry a great deal of weight, especially with individual investors. Therefore, a good portion of institutional money invested in the company is usually a huge vote of confidence on its future.
Let's take a closer look to see what the different types of shareholders can tell us about AB Industrivärden.
See our latest analysis for AB Industrivärden
What Does The Institutional Ownership Tell Us About AB Industrivärden?
Institutions typically measure themselves against a benchmark when reporting to their own investors, so they often become more enthusiastic about a stock once it's included in a major index. We would expect most companies to have some institutions on the register, especially if they are growing.
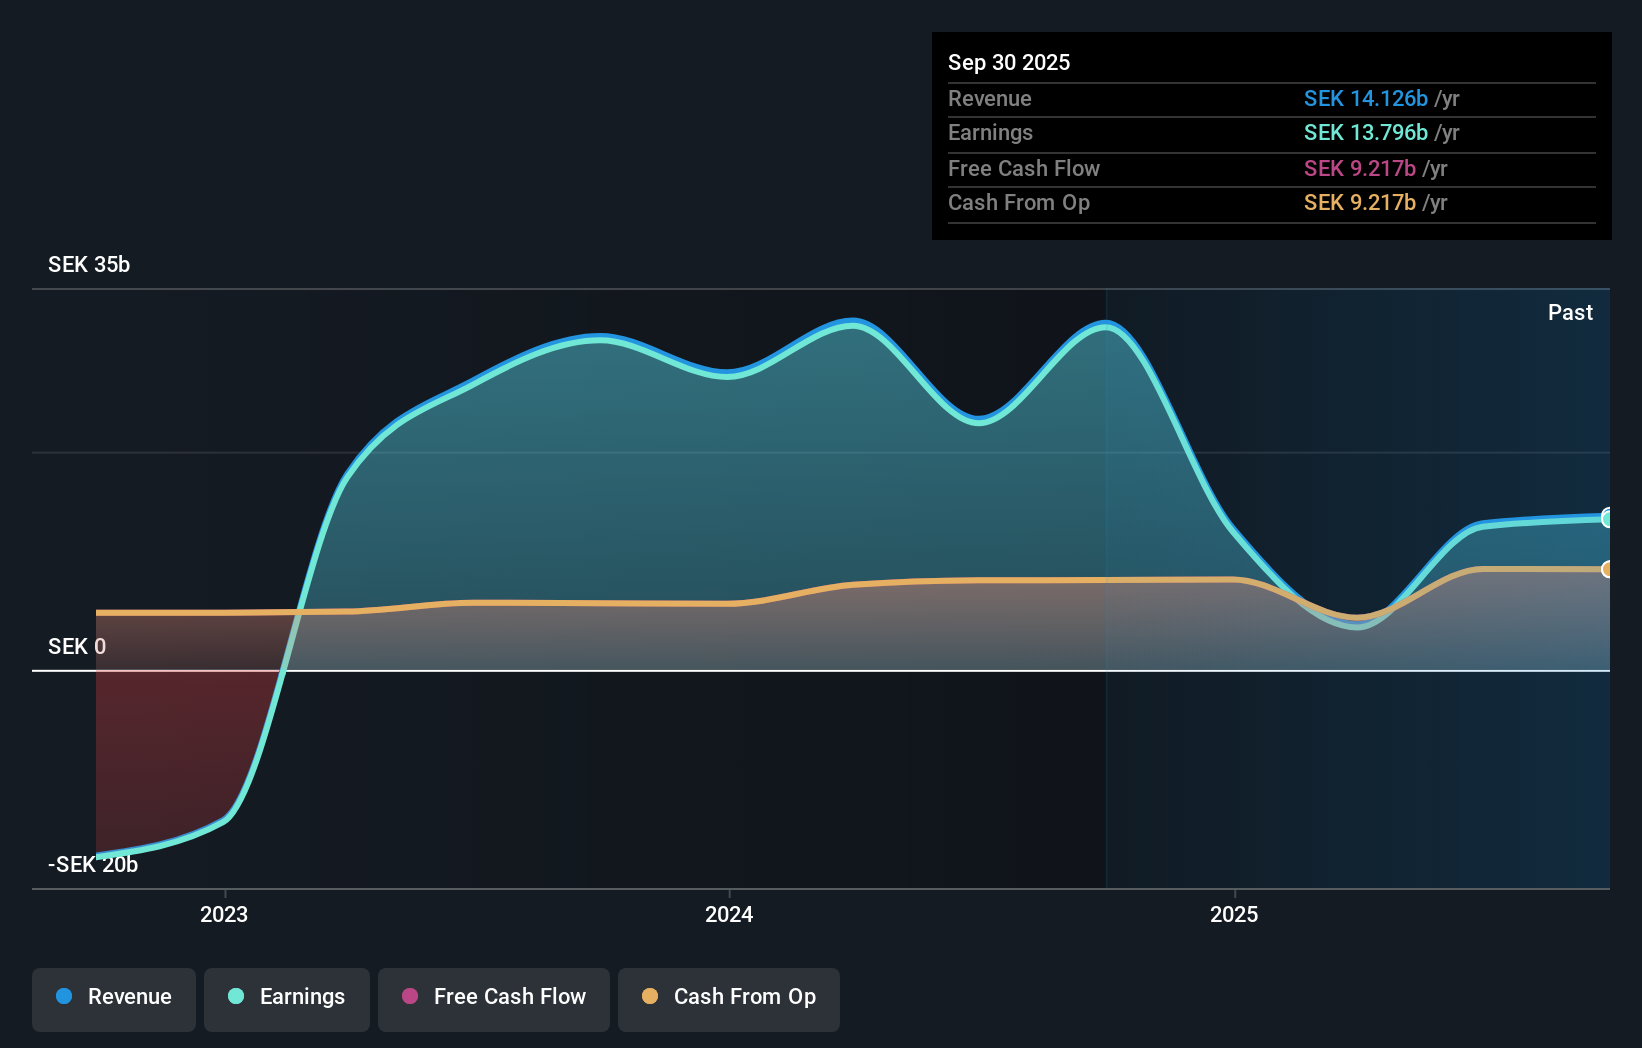
AB Industrivärden already has institutions on the share registry. Indeed, they own a respectable stake in the company. This can indicate that the company has a certain degree of credibility in the investment community. However, it is best to be wary of relying on the supposed validation that comes with institutional investors. They too, get it wrong sometimes. It is not uncommon to see a big share price drop if two large institutional investors try to sell out of a stock at the same time. So it is worth checking the past earnings trajectory of AB Industrivärden, (below). Of course, keep in mind that there are other factors to consider, too.
AB Industrivärden is not owned by hedge funds. L E Lundbergföretagen AB (publ) is currently the largest shareholder, with 22% of shares outstanding. For context, the second largest shareholder holds about 9.4% of the shares outstanding, followed by an ownership of 5.7% by the third-largest shareholder.
We did some more digging and found that 8 of the top shareholders account for roughly 52% of the register, implying that along with larger shareholders, there are a few smaller shareholders, thereby balancing out each others interests somewhat.
While it makes sense to study institutional ownership data for a company, it also makes sense to study analyst sentiments to know which way the wind is blowing. We're not picking up on any analyst coverage of the stock at the moment, so the company is unlikely to be widely held.
Insider Ownership Of AB Industrivärden
While the precise definition of an insider can be subjective, almost everyone considers board members to be insiders. Company management run the business, but the CEO will answer to the board, even if he or she is a member of it.
Insider ownership is positive when it signals leadership are thinking like the true owners of the company. However, high insider ownership can also give immense power to a small group within the company. This can be negative in some circumstances.
Our most recent data indicates that insiders own some shares in AB Industrivärden (publ). Insiders own kr10b worth of shares (at current prices). we sometimes take an interest in whether they have been buying or selling.
General Public Ownership
With a 30% ownership, the general public, mostly comprising of individual investors, have some degree of sway over AB Industrivärden. While this size of ownership may not be enough to sway a policy decision in their favour, they can still make a collective impact on company policies.
Public Company Ownership
It appears to us that public companies own 22% of AB Industrivärden. We can't be certain but it is quite possible this is a strategic stake. The businesses may be similar, or work together.
Next Steps:
I find it very interesting to look at who exactly owns a company. But to truly gain insight, we need to consider other information, too. Take risks for example - AB Industrivärden has 1 warning sign we think you should be aware of.
Of course, you might find a fantastic investment by looking elsewhere. So take a peek at this free list of interesting companies.
NB: Figures in this article are calculated using data from the last twelve months, which refer to the 12-month period ending on the last date of the month the financial statement is dated. This may not be consistent with full year annual report figures.
Have feedback on this article? Concerned about the content? Get in touch with us directly. Alternatively, email editorial-team (at) simplywallst.com.
This article by Simply Wall St is general in nature. We provide commentary based on historical data and analyst forecasts only using an unbiased methodology and our articles are not intended to be financial advice. It does not constitute a recommendation to buy or sell any stock, and does not take account of your objectives, or your financial situation. We aim to bring you long-term focused analysis driven by fundamental data. Note that our analysis may not factor in the latest price-sensitive company announcements or qualitative material. Simply Wall St has no position in any stocks mentioned.