
- PREMIUM
- LIVE QUOTES
- INSTITUTIONS
 Index Options
 State Street
 CME Group
 Nasdaq
 Cboe
Cboe TradingView
 Wall Street Journal
Is FIGS Stock Price Justified After Its 97% Surge in 2025?
- If you are wondering whether FIGS is still a smart buy after its big recovery, you are not alone. This stock has attracted a lot of attention from investors trying to work out if the current price reflects its true value.
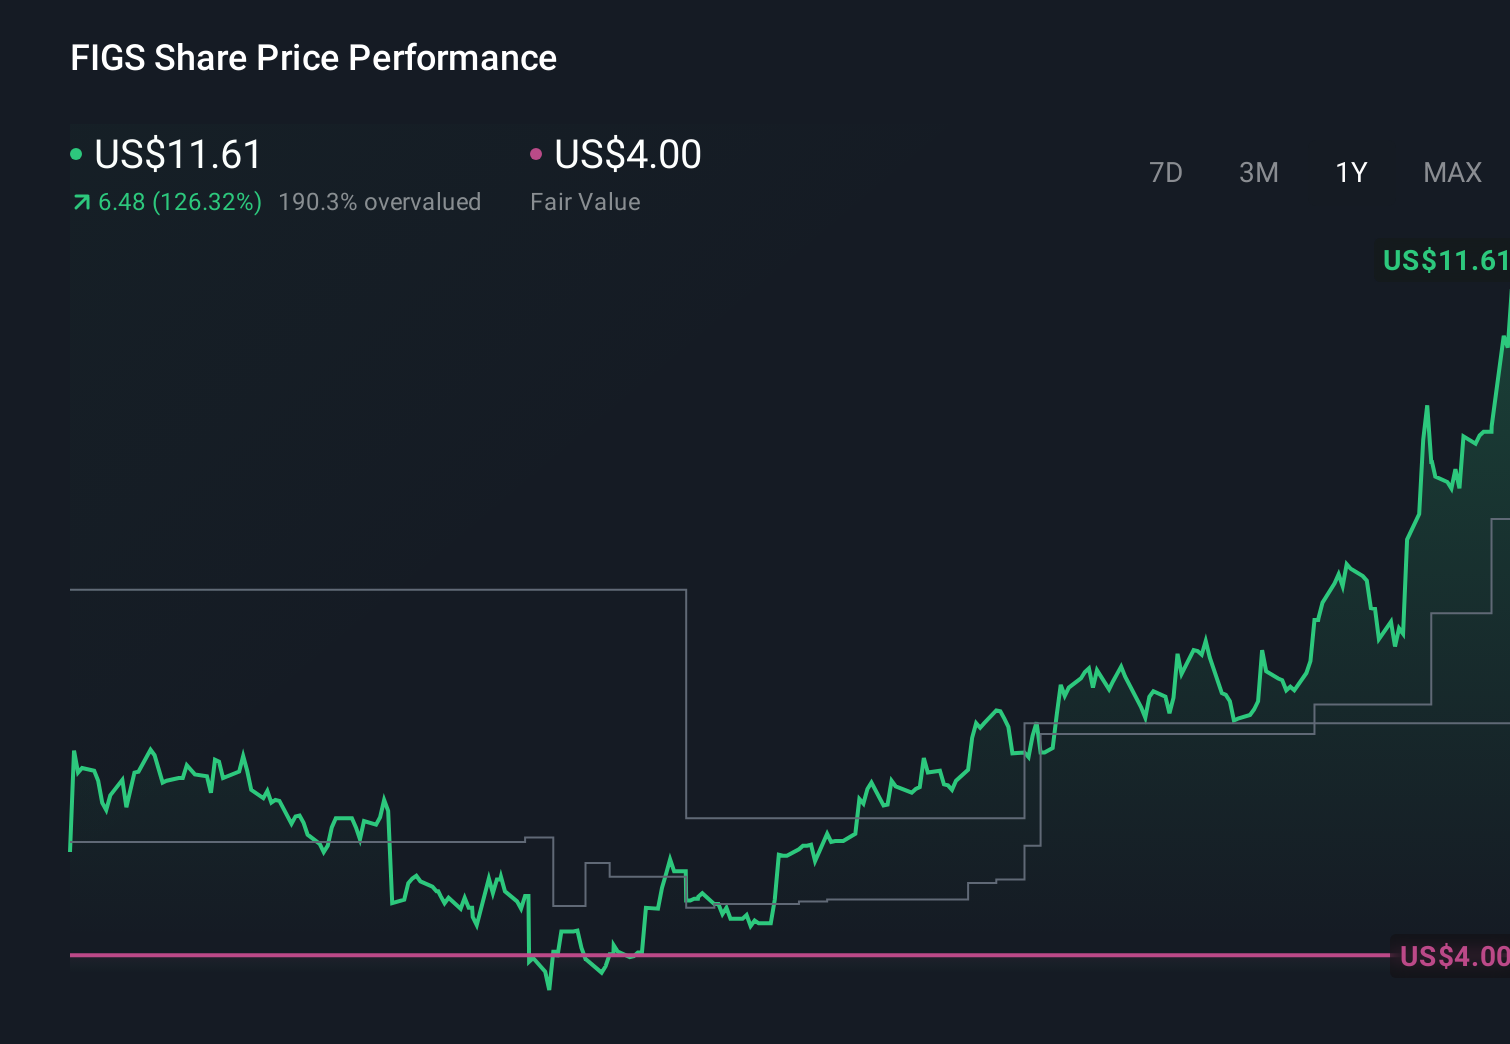
- Over the past week FIGS is up 2.8%. It has climbed 31.5% over the last month, 97.1% year to date, and 86.1% over the last year, a huge swing that can signal both rising optimism and a shift in how the market views its risk and growth profile.
- That surge has come as investors refocus on FIGS' position as a premium scrubs brand with a loyal customer base and ongoing product expansion, rather than treating it as just another pandemic winner. Recent commentary around healthcare staffing trends, direct to consumer retail, and brand driven niches in apparel has also put a spotlight back on companies like FIGS, helping to justify some of the renewed interest.
- Yet on our valuation checks FIGS scores just 0/6. This suggests the market may already be pricing in a lot of that optimism. Next we will break down what different valuation approaches say about the stock, and then look at an additional way to judge whether the current price truly makes sense.
FIGS scores just 0/6 on our valuation checks. See what other red flags we found in the full valuation breakdown.
Approach 1: FIGS Discounted Cash Flow (DCF) Analysis
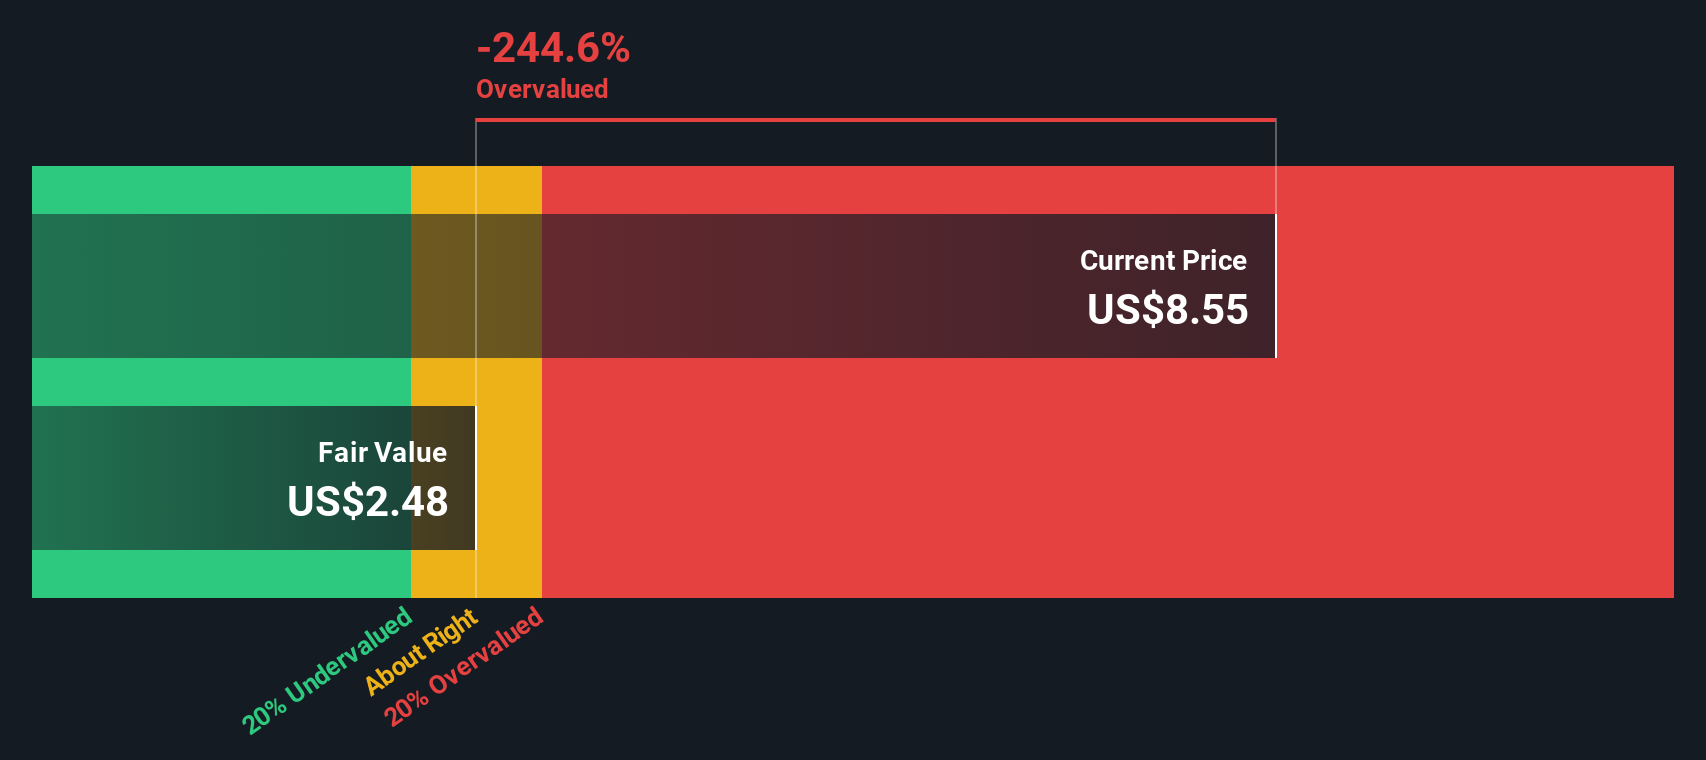
A Discounted Cash Flow (DCF) model estimates what a company is worth today by projecting its future cash flows and discounting them back to the present. For FIGS, the 2 Stage Free Cash Flow to Equity model starts with current last twelve months free cash flow of about $16.9 Million and then layers on analyst forecasts and longer term extrapolations.
Analysts see FIGS' free cash flow rising to around $44.96 Million in 2026 and $52.64 Million by 2029, with Simply Wall St extending the projections out to 2035 as growth gradually tapers off. All of those future $ cash flows are discounted back to today to arrive at an estimated intrinsic value of roughly $2.37 per share.
Compared with the current market price, the model implies FIGS is about 390.6% overvalued, suggesting investors are paying far more than what these projected cash flows support.
Result: OVERVALUED
Our Discounted Cash Flow (DCF) analysis suggests FIGS may be overvalued by 390.6%. Discover 903 undervalued stocks or create your own screener to find better value opportunities.
Approach 2: FIGS Price vs Earnings
For a profitable business like FIGS, the price to earnings, or PE, ratio is a useful way to gauge whether investors are paying a reasonable price for each dollar of current earnings. In general, faster growing and lower risk companies tend to justify a higher PE, while slower growth or higher uncertainty usually calls for a lower, more conservative multiple.
FIGS currently trades on a PE of about 108.34x, which is far richer than both the Luxury industry average of roughly 20.65x and the peer group average of around 15.29x. To move beyond simple comparisons, Simply Wall St also calculates a proprietary Fair Ratio of 22.32x, which represents the PE you might expect given FIGS earnings growth outlook, profitability, industry positioning, size and risk profile.
This Fair Ratio framework is more informative than just lining FIGS up against peers, because it adjusts for company specific factors like margins, volatility and scale, rather than assuming all businesses in the space deserve the same multiple. Compared with the 22.32x Fair Ratio, the current 108.34x PE suggests FIGS is trading well above what its fundamentals would typically support.
Result: OVERVALUED

PE ratios tell one story, but what if the real opportunity lies elsewhere? Discover 1450 companies where insiders are betting big on explosive growth.
Upgrade Your Decision Making: Choose your FIGS Narrative
Earlier we mentioned that there is an even better way to understand valuation, so let us introduce you to Narratives, a simple way to connect the story you believe about a company with the numbers behind its future revenue, earnings, margins and fair value. A Narrative on Simply Wall St is your view of how a business will grow, compete and manage risks, translated into a financial forecast and then into an estimated fair value per share that you can directly compare to the current market price to decide whether to buy, hold or sell. Narratives are available within the Community page on Simply Wall St, used by millions of investors, and they update dynamically as new information such as earnings releases or major news is incorporated. This helps ensure that your fair value estimate remains current. For FIGS, one investor might build a Narrative that assumes strong global expansion, sustained premium pricing and rising margins that point to a fair value closer to $8.78, while another may focus on tariff pressure, competition and execution risk that supports a more cautious fair value near $7.21.
Do you think there's more to the story for FIGS? Head over to our Community to see what others are saying!
This article by Simply Wall St is general in nature. We provide commentary based on historical data and analyst forecasts only using an unbiased methodology and our articles are not intended to be financial advice. It does not constitute a recommendation to buy or sell any stock, and does not take account of your objectives, or your financial situation. We aim to bring you long-term focused analysis driven by fundamental data. Note that our analysis may not factor in the latest price-sensitive company announcements or qualitative material. Simply Wall St has no position in any stocks mentioned.
Have feedback on this article? Concerned about the content? Get in touch with us directly. Alternatively, email editorial-team@simplywallst.com