
- PREMIUM
- LIVE QUOTES
- INSTITUTION
 Index Options
 State Street
 CME Group
 Nasdaq
 Cboe
Cboe TradingView
 Wall Street Journal
Is EPAM Systems a Recovery Story After Recent Share Price Rebound?
- Wondering if EPAM Systems at around $208 is a recovery story or a value trap? You are not alone, and this piece is going to dig into what the current price really implies.
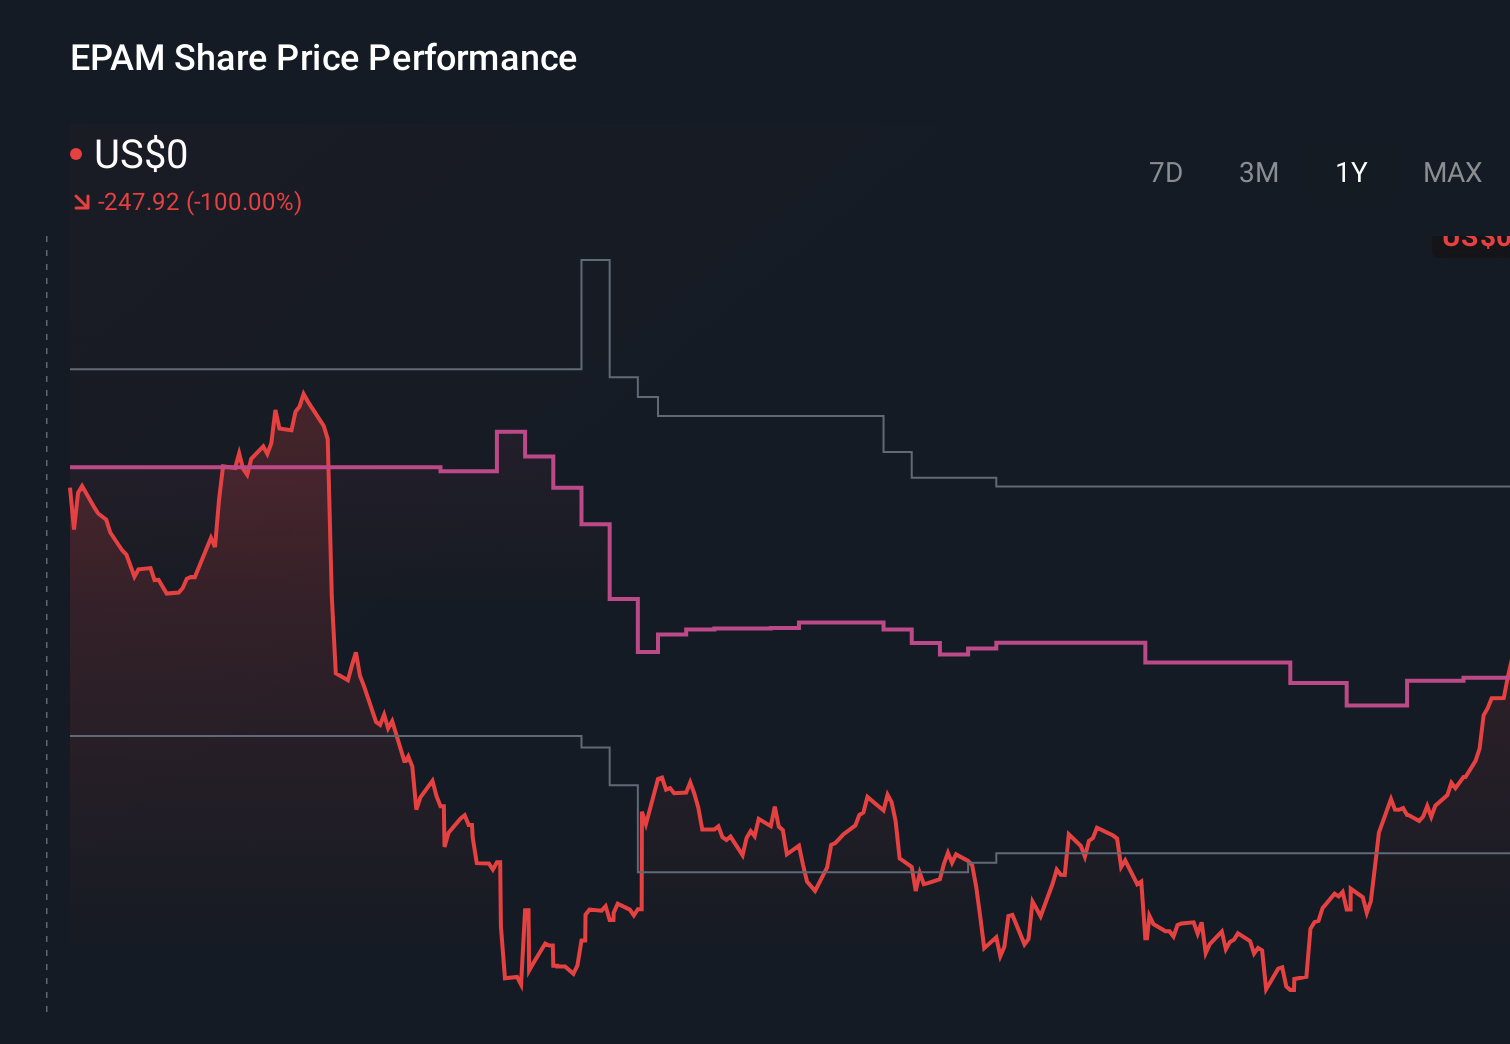
- The stock has bounced about 7.8% over the last week and 18.6% over the past month, even though it is still down 9.2% year to date and 16.8% over the last year, with a much steeper slide of 42.9% over three years and 36.2% over five years.
- Much of this recent volatility has been tied to shifting sentiment around IT services and digital transformation spending, as investors reassess which software engineering partners can keep growing through a choppy macro backdrop. EPAM has also been in the headlines for ongoing adjustments to its delivery footprint and client mix, which together have reshaped expectations for its long term growth profile.
- Right now, EPAM scores a 2/6 valuation check score, suggesting only limited signs of being undervalued on traditional metrics. Next we will walk through the main valuation approaches investors are using today and then finish with a more holistic way to judge what the stock is really worth.
EPAM Systems scores just 2/6 on our valuation checks. See what other red flags we found in the full valuation breakdown.
Approach 1: EPAM Systems Discounted Cash Flow (DCF) Analysis
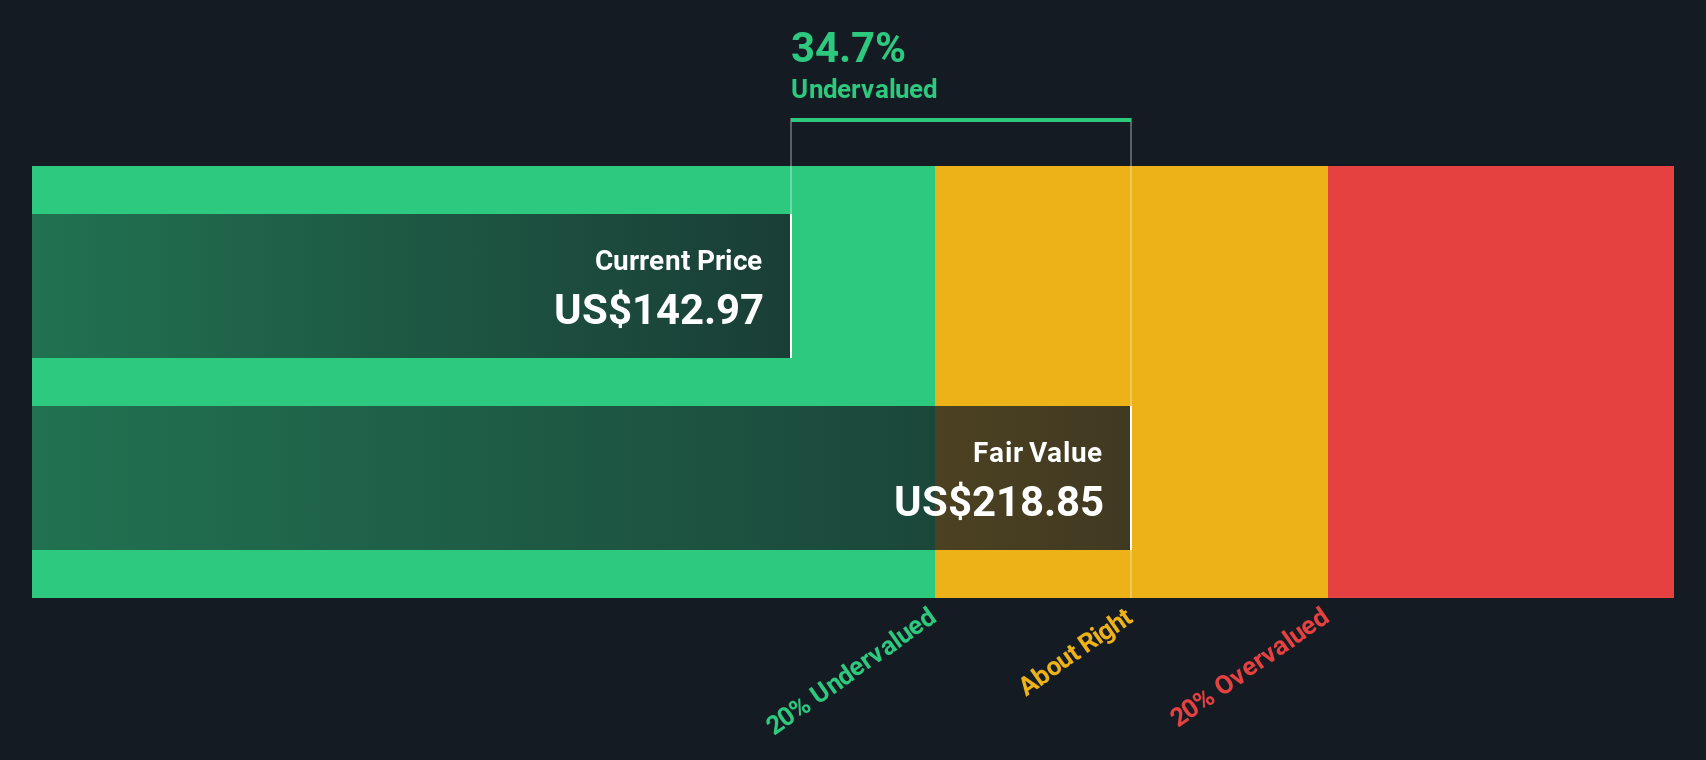
A Discounted Cash Flow model estimates what a business is worth by projecting its future cash flows and then discounting those back to today, using a required rate of return. For EPAM Systems, the model starts with last twelve months Free Cash Flow of about $462.8 million and uses analyst forecasts for the next few years, then extrapolates further based on slowing growth assumptions.
Under this 2 Stage Free Cash Flow to Equity approach, EPAM’s Free Cash Flow is projected to rise to roughly $946.7 million by 2035, with the intermediate years steadily building from current levels as the business scales. These future cash flows, expressed in dollars, are discounted back to the present and summed to arrive at an estimated intrinsic value of about $220.41 per share.
With the stock currently trading around $208, the DCF implies EPAM is roughly 5.6% undervalued. This represents a modest valuation gap rather than an extreme mispricing.
Result: ABOUT RIGHT
EPAM Systems is fairly valued according to our Discounted Cash Flow (DCF), but this can change at a moment's notice. Track the value in your watchlist or portfolio and be alerted on when to act.
Approach 2: EPAM Systems Price vs Earnings
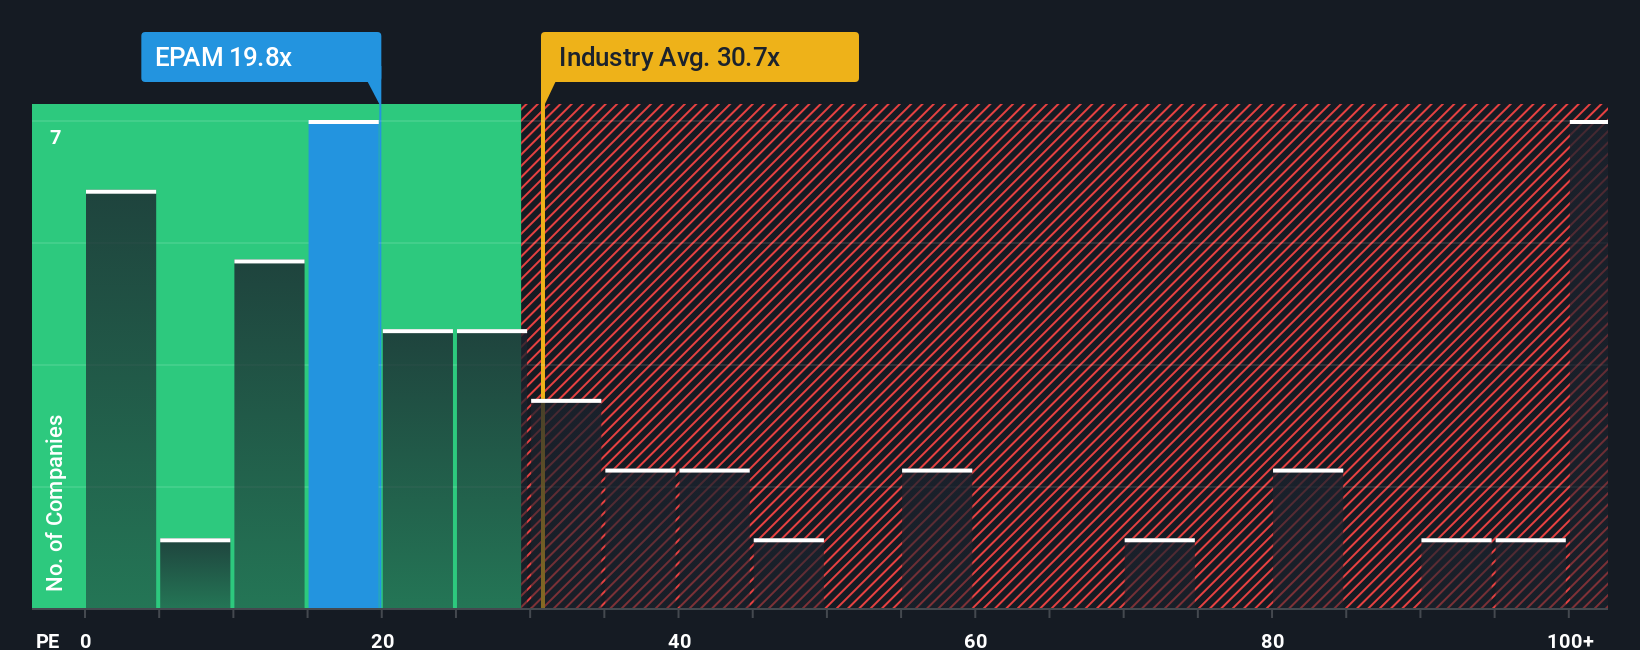
For profitable companies like EPAM Systems, the Price to Earnings (PE) ratio is a useful yardstick because it links what investors pay directly to the profits the business is generating today. In general, faster and more predictable earnings growth justifies a higher PE, while slower growth, cyclicality or higher risk usually demands a lower, more conservative multiple.
EPAM currently trades on a PE of about 30.9x, which is roughly in line with the broader IT industry average of around 30.5x, but well above the peer group average of about 16.8x. Simply Wall St also calculates a proprietary Fair Ratio for EPAM of roughly 32.2x, which represents the PE you might expect given its specific mix of earnings growth prospects, margins, industry positioning, size and risk profile. This Fair Ratio is more tailored than a simple peer or industry comparison because it adjusts for how EPAM differs from those groups rather than assuming all IT services firms deserve the same multiple. On this basis, EPAM’s current PE sits slightly below its Fair Ratio, which indicates a modest discount rather than an aggressive premium.
Result: UNDERVALUED
PE ratios tell one story, but what if the real opportunity lies elsewhere? Discover 1450 companies where insiders are betting big on explosive growth.
Upgrade Your Decision Making: Choose your EPAM Systems Narrative
Earlier we mentioned that there is an even better way to understand valuation, so let us introduce you to Narratives, a simple way to attach a clear story, your view of a company’s future revenue, earnings and margins, to the numbers behind its fair value. A Narrative connects three pieces: what you think will shape a company’s future, how that translates into a financial forecast, and the fair value that drops out of those assumptions. On Simply Wall St’s Community page, used by millions of investors, Narratives are an easy, accessible tool that help you compare your Fair Value to the current market price so you can decide whether EPAM is a buy, hold or sell for you. Because Narratives update dynamically when new information, like earnings or major AI related announcements, comes in, your view stays current rather than static. For EPAM Systems right now, one investor might build a bullish Narrative with a fair value near $246 based on strong AI transition upside, while another might take a more cautious stance with fair value closer to $171, and Narratives make those differing perspectives, and the gaps to today’s price, instantly visible.
Do you think there's more to the story for EPAM Systems? Head over to our Community to see what others are saying!
This article by Simply Wall St is general in nature. We provide commentary based on historical data and analyst forecasts only using an unbiased methodology and our articles are not intended to be financial advice. It does not constitute a recommendation to buy or sell any stock, and does not take account of your objectives, or your financial situation. We aim to bring you long-term focused analysis driven by fundamental data. Note that our analysis may not factor in the latest price-sensitive company announcements or qualitative material. Simply Wall St has no position in any stocks mentioned.
Have feedback on this article? Concerned about the content? Get in touch with us directly. Alternatively, email editorial-team@simplywallst.com